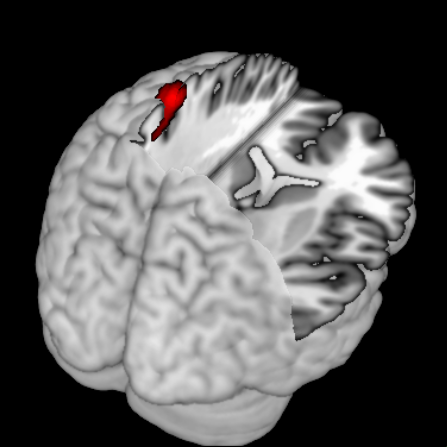
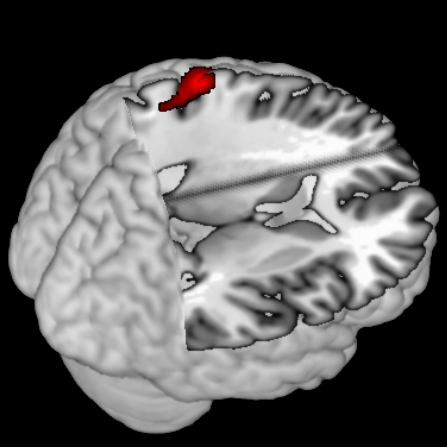
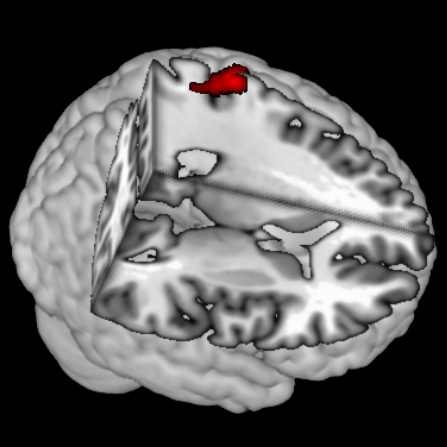
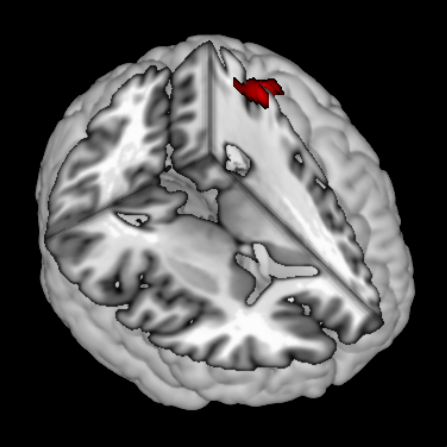
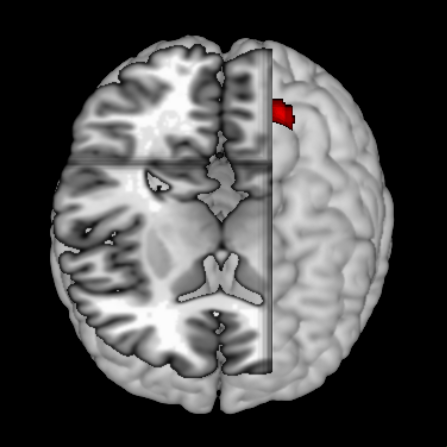
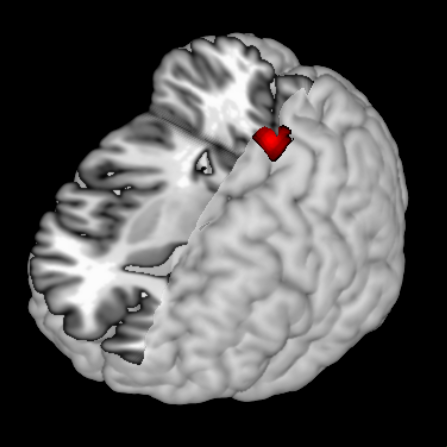
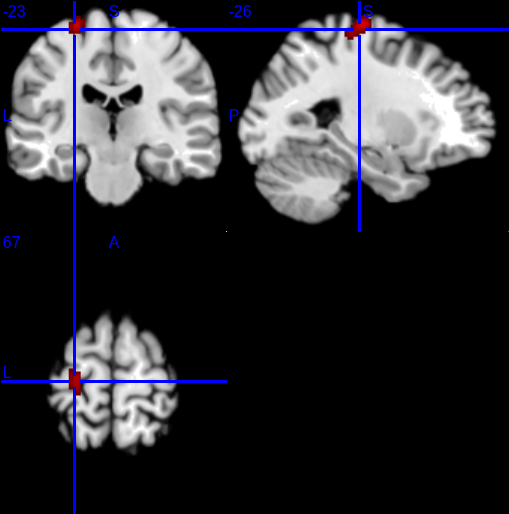
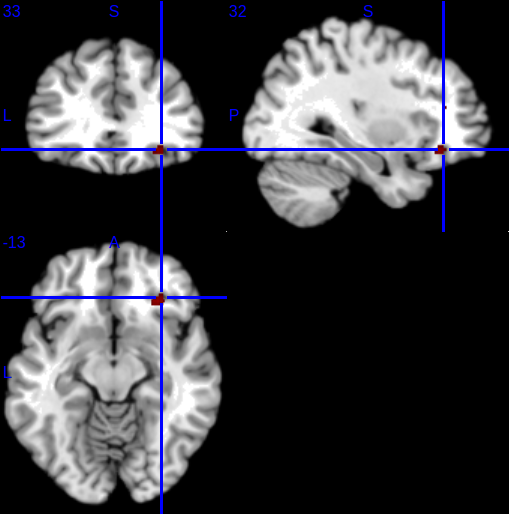
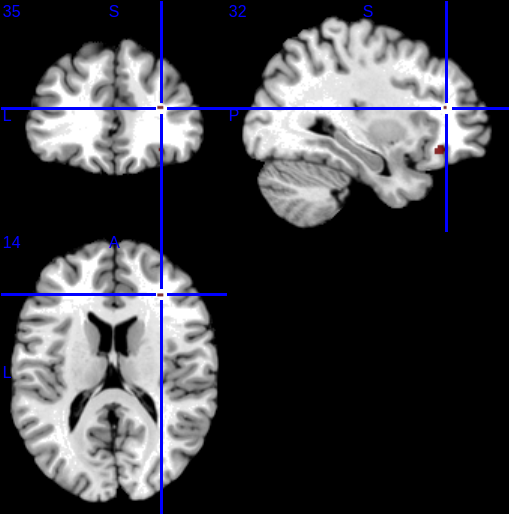
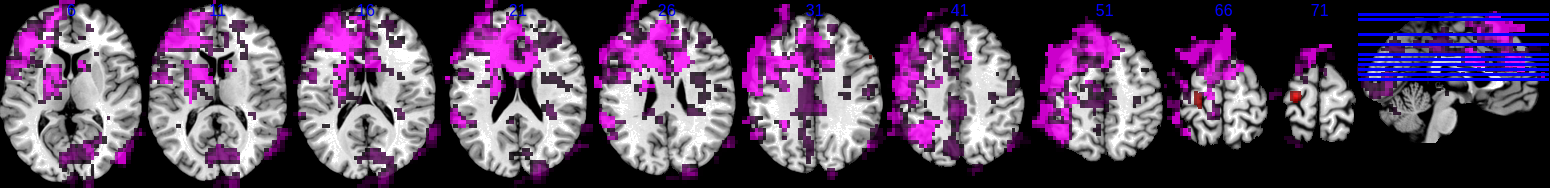
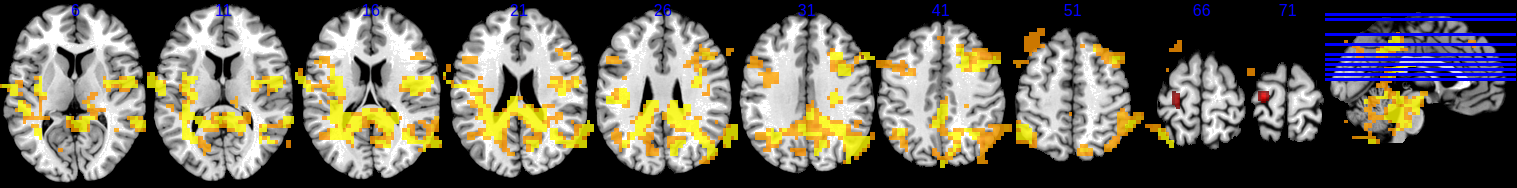
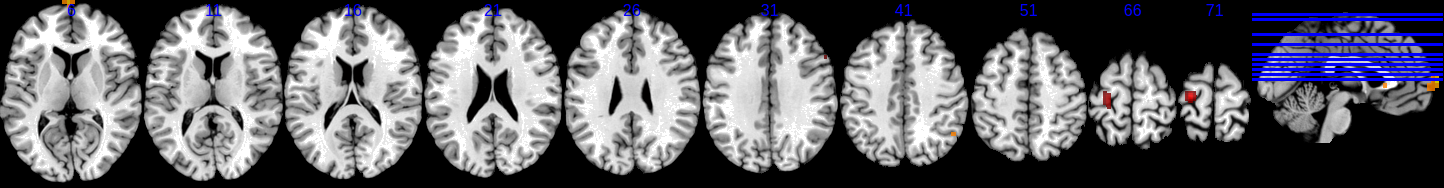
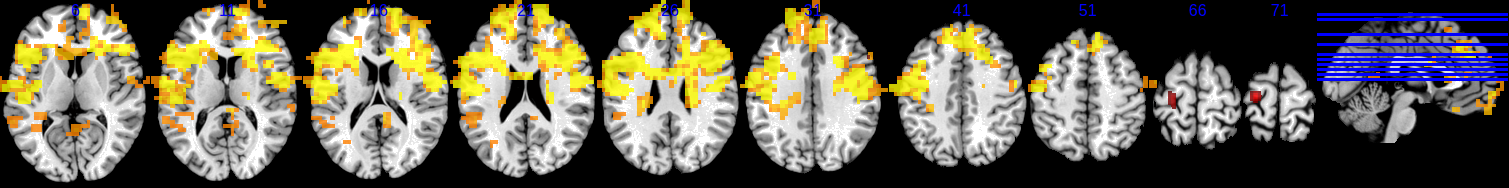
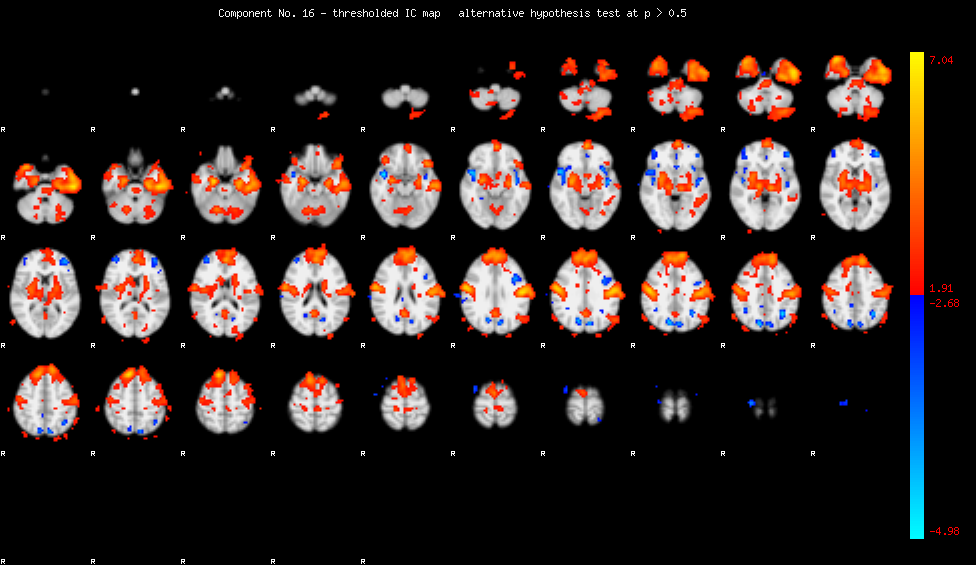
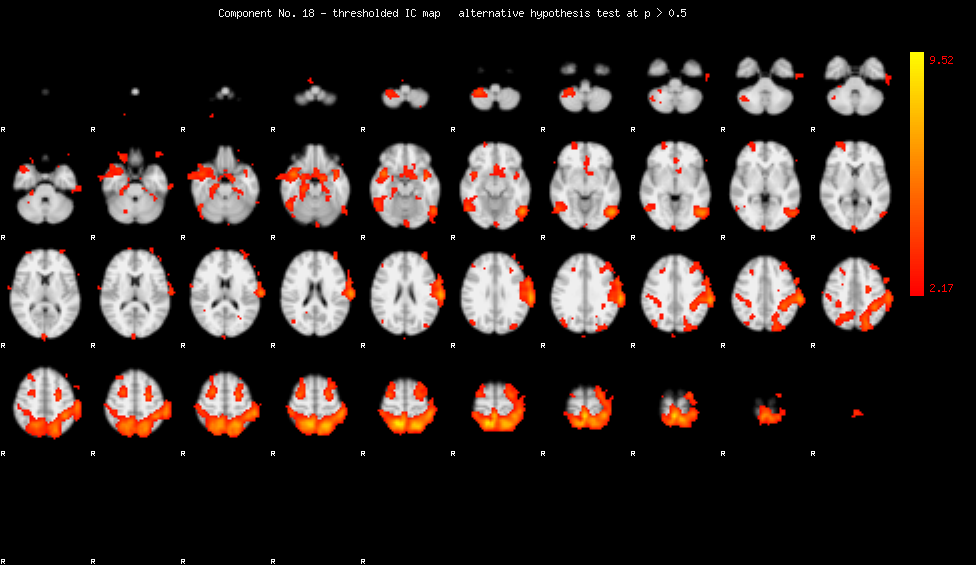
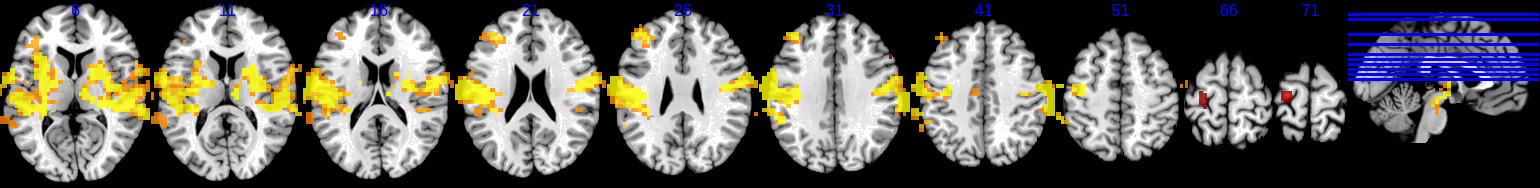
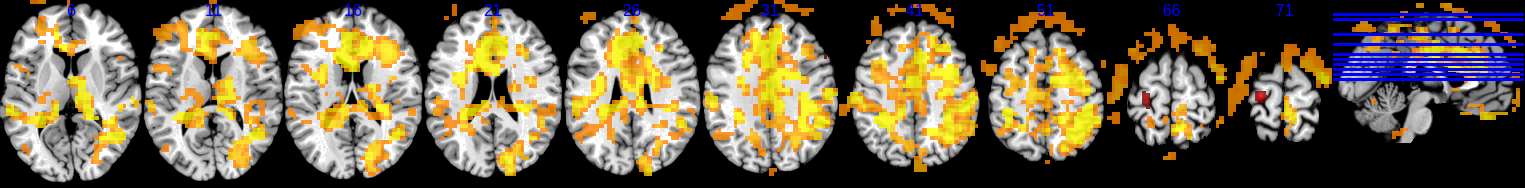
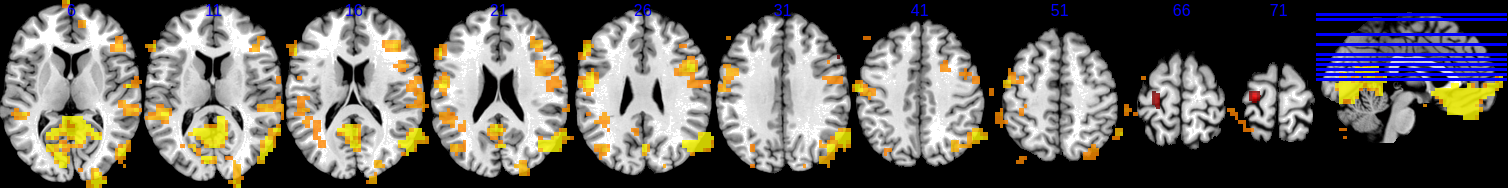
The meta analysis produced two main clusters (and one tiny third cluster), which are displayed above, and max voxel coordinates from these clusters are displayed in the table below.
| Cluster # | Volume (mm^3) | Weighted Center (x,y,z) | Extrema Value | x | y | z | Label | ||
| 1 | 1624 | -23.5 | -24.24 | 67.49 | 0.027770476 | -24 | -20 | 70 | Left Cerebrum.Frontal Lobe.Precentral Gyrus.Gray Matter.Brodmann area 4 |
| 0.018035918 | -24 | -28 | 64 | Left Cerebrum.Parietal Lobe.Postcentral Gyrus.Gray Matter.Brodmann area 3 | |||||
| 0.0135961175 | -18 | -38 | 62 | Left Cerebrum.Frontal Lobe.Paracentral Lobule.Gray Matter.Brodmann area 5 | |||||
| 2 | 256 | 29.71 | 30 | -14.39 | 0.016289186 | 30 | 30 | -14 | Right Cerebrum.Frontal Lobe.Inferior Frontal Gyrus.Gray Matter.Brodmann area 47 |

| Z | COORD SPACE | MNI SPACE | Talairach | Label | |||||||||||
| I | j | k | x | y | z | X coor | Y coor | Z coor | Level 1 | Level 2 | Level 3 | Level 4 | Level 5 | Appended Data | |
| 0.051 | 29 | 29 | 29 | -26 | -10 | 44 | -25.82 | -12.84 | 42.08 | Left Cerebrum | Frontal Lobe | Sub-Gyral | White Matter | * | |
| 0.091 | 30 | 32 | 17 | -30 | 2 | -4 | -29.44 | 1.35 | -0.45 | Left Cerebrum | Sub-lobar | Lentiform Nucleus | Gray Matter | Putamen | |
| 0.111 | 28 | 24 | 17 | -22 | -30 | -4 | -21.98 | -29.05 | -2.38 | Left Brainstem | Midbrain | * | * | * | |
| 0.162 | 31 | 29 | 17 | -34 | -10 | -4 | -33.27 | -9.99 | -1.21 | Left Cerebrum | Sub-lobar | Extra-Nuclear | White Matter | * | |
| 0.396 | 24 | 29 | 34 | -6 | -10 | 64 | -6.95 | -14.17 | 60.2 | Left Cerebrum | Frontal Lobe | Medial Frontal Gyrus | White Matter | * | |
| 0.694 | 17 | 25 | 29 | 22 | -26 | 44 | 19.55 | -28.4 | 41.34 | Right Cerebrum | Limbic Lobe | Cingulate Gyrus | Gray Matter | Brodmann area 31 |


| Z | COORD SPACE | MNI SPACE | Talairach | Label | |||||||||||
| I | j | k | x | y | z | X coor | Y coor | Z coor | Level 1 | Level 2 | Level 3 | Level 4 | Level 5 | Appended Data | |
| 0.142 | 27 | 11 | 20 | -18 | -82 | 8 | -18.4 | -79.07 | 5.24 | Left Cerebrum | Occipital Lobe | Lingual Gyrus | White Matter | * | |
| 0.15 | 21 | 13 | 8 | 6 | -74 | -40 | 4.46 | -68.9 | -37.39 | Right Cerebellum | Posterior Lobe | Inferior Semi-Lunar Lobule | Gray Matter | * | |
| 0.174 | 31 | 11 | 20 | -34 | -82 | 8 | -33.55 | -78.93 | 5.16 | Left Cerebrum | Occipital Lobe | Middle Occipital Gyrus | White Matter | * | |
| 0.21 | 13 | 10 | 6 | 38 | -86 | -48 | 34.73 | -80.07 | -45.16 | * | * | * | * | * | |
| 0.261 | 31 | 13 | 20 | -34 | -74 | 8 | -33.52 | -71.35 | 5.65 | Left Cerebrum | Occipital Lobe | Middle Occipital Gyrus | White Matter | * | |
| 0.285 | 15 | 13 | 7 | 30 | -74 | -44 | 27.19 | -68.87 | -40.86 | Right Cerebellum | Posterior Lobe | Inferior Semi-Lunar Lobule | Gray Matter | * |

| Z | COORD SPACE | MNI SPACE | Talairach | Label | |||||||||||
| I | j | k | x | y | z | X coor | Y coor | Z coor | Level 1 | Level 2 | Level 3 | Level 4 | Level 5 | Appended Data | |
| 0.603 | 29 | 34 | 25 | -26 | 10 | 28 | -25.71 | 7.05 | 28.9 | Left Cerebrum | Frontal Lobe | Sub-Gyral | White Matter | * | |
| 0.607 | 28 | 40 | 20 | -22 | 34 | 8 | -21.79 | 30.92 | 12.38 | Left Cerebrum | Frontal Lobe | Sub-Gyral | White Matter | * | |
| 0.666 | 33 | 36 | 32 | -42 | 18 | 56 | -40.9 | 13.14 | 54.53 | Left Cerebrum | Frontal Lobe | Middle Frontal Gyrus | * | * | |
| 0.678 | 37 | 28 | 27 | -58 | -14 | 36 | -56.1 | -15.9 | 34.45 | Left Cerebrum | Frontal Lobe | Precentral Gyrus | Gray Matter | Brodmann area 4 | |
| 0.694 | 38 | 30 | 26 | -62 | -6 | 32 | -59.85 | -8.05 | 31.32 | Left Cerebrum | Frontal Lobe | Precentral Gyrus | White Matter | * | |
| 0.718 | 27 | 36 | 23 | -18 | 18 | 20 | -18.09 | 15.03 | 22.22 | Left Cerebrum | Frontal Lobe | Sub-Gyral | White Matter | * |


| Z | COORD SPACE | MNI SPACE | Talairach | Label | |||||||||||
| I | j | k | x | y | z | X coor | Y coor | Z coor | Level 1 | Level 2 | Level 3 | Level 4 | Level 5 | Appended Data | |
| 0.003 | 22 | 35 | 17 | 2 | 14 | -4 | 0.88 | 12.46 | 0.46 | Inter-Hemispheric | * | * | * | * | |
| 0.003 | 28 | 29 | 15 | -22 | -10 | -12 | -21.89 | -9.62 | -8.36 | Left Cerebrum | Sub-lobar | * | Gray Matter | Amygdala | |
| 0.011 | 30 | 30 | 18 | -30 | -6 | 0 | -29.48 | -6.46 | 2.66 | Left Cerebrum | Sub-lobar | Lentiform Nucleus | Gray Matter | Putamen | |
| 0.015 | 12 | 18 | 28 | 42 | -54 | 40 | 38.39 | -54.88 | 36.12 | Right Cerebrum | Parietal Lobe | Angular Gyrus | White Matter | * | |
| 0.027 | 14 | 16 | 27 | 34 | -62 | 36 | 30.81 | -62.16 | 31.98 | Right Cerebrum | Parietal Lobe | Sub-Gyral | White Matter | * | |
| 0.043 | 30 | 31 | 22 | -30 | -2 | 16 | -29.51 | -3.6 | 17.32 | Left Cerebrum | Sub-lobar | Extra-Nuclear | White Matter | * |

| Z | COORD SPACE | MNI SPACE | Talairach | Label | |||||||||||
| I | j | k | x | y | z | X coor | Y coor | Z coor | Level 1 | Level 2 | Level 3 | Level 4 | Level 5 | Appended Data | |
| 0.194 | 18 | 20 | 25 | 18 | -46 | 28 | 15.74 | -46.4 | 25.67 | Right Cerebrum | Parietal Lobe | Sub-Gyral | White Matter | * | |
| 0.198 | 24 | 26 | 13 | -6 | -22 | -20 | -6.77 | -20.67 | -16.22 | Left Brainstem | Midbrain | * | * | * | |
| 0.202 | 31 | 22 | 21 | -34 | -38 | 12 | -33.41 | -37.46 | 11.48 | Left Cerebrum | Temporal Lobe | Sub-Gyral | White Matter | * | |
| 0.246 | 12 | 14 | 24 | 42 | -70 | 24 | 38.38 | -69.12 | 20.72 | Right Cerebrum | Temporal Lobe | Middle Temporal Gyrus | White Matter | * | |
| 0.265 | 16 | 18 | 27 | 26 | -54 | 36 | 23.26 | -54.51 | 32.43 | Right Cerebrum | Parietal Lobe | Precuneus | White Matter | * | |
| 0.333 | 24 | 22 | 10 | -6 | -38 | -32 | -6.79 | -35.14 | -28.02 | Left Brainstem | Pons | * | * | * |

| Z | COORD SPACE | MNI SPACE | Talairach | Label | |||||||||||
| I | j | k | x | y | z | X coor | Y coor | Z coor | Level 1 | Level 2 | Level 3 | Level 4 | Level 5 | Appended Data | |
| 0.718 | 29 | 13 | 24 | -26 | -74 | 24 | -25.99 | -72.34 | 20.11 | Left Cerebrum | Occipital Lobe | Precuneus | White Matter | * | |
| 0.726 | 36 | 18 | 10 | -54 | -54 | -32 | -52.27 | -49.91 | -29.26 | Left Cerebellum | Posterior Lobe | Tuber | Gray Matter | * | |
| 0.738 | 35 | 15 | 20 | -50 | -66 | 8 | -48.63 | -63.63 | 6.06 | Left Cerebrum | Temporal Lobe | Middle Temporal Gyrus | White Matter | * | |
| 0.746 | 11 | 40 | 28 | 46 | 34 | 40 | 42.48 | 28.5 | 41.57 | Right Cerebrum | Frontal Lobe | Middle Frontal Gyrus | Gray Matter | Brodmann area 8 | |
| 0.757 | 30 | 15 | 29 | -30 | -66 | 44 | -29.8 | -65.89 | 38.6 | Left Cerebrum | Parietal Lobe | Precuneus | White Matter | * | |
| 0.793 | 35 | 10 | 20 | -50 | -86 | 8 | -48.7 | -82.59 | 4.83 | Left Cerebrum | Occipital Lobe | Middle Occipital Gyrus | Gray Matter | Brodmann area 19 |

| Z | COORD SPACE | MNI SPACE | Talairach | Label | |||||||||||
| I | j | k | x | y | z | X coor | Y coor | Z coor | Level 1 | Level 2 | Level 3 | Level 4 | Level 5 | Appended Data | |
| 0.507 | 14 | 12 | 10 | 34 | -78 | -32 | 30.93 | -73.39 | -30.28 | Right Cerebellum | Posterior Lobe | Tuber | Gray Matter | * | |
| 0.551 | 33 | 32 | 23 | -42 | 2 | 20 | -40.86 | 0.06 | 21.11 | Left Cerebrum | Frontal Lobe | Sub-Gyral | White Matter | * | |
| 0.551 | 13 | 11 | 8 | 38 | -82 | -40 | 34.72 | -76.75 | -37.71 | Right Cerebellum | Posterior Lobe | Inferior Semi-Lunar Lobule | Gray Matter | * | |
| 0.571 | 18 | 36 | 15 | 18 | 18 | -12 | 16.06 | 16.58 | -6.42 | Right Cerebrum | Sub-lobar | Extra-Nuclear | White Matter | * | |
| 0.682 | 20 | 28 | 29 | 10 | -14 | 44 | 8.23 | -16.93 | 42.02 | Right Cerebrum | Limbic Lobe | Cingulate Gyrus | Gray Matter | Brodmann area 24 | |
| 0.869 | 29 | 44 | 23 | -26 | 50 | 20 | -25.56 | 45.43 | 24.16 | Left Cerebrum | Frontal Lobe | Superior Frontal Gyrus | Gray Matter | Brodmann area 10 |

| Z | COORD SPACE | MNI SPACE | Talairach | Label | |||||||||||
| I | j | k | x | y | z | X coor | Y coor | Z coor | Level 1 | Level 2 | Level 3 | Level 4 | Level 5 | Appended Data | |
| 0.317 | 7 | 34 | 26 | 62 | 10 | 32 | 57.56 | 6.08 | 32.97 | Right Cerebrum | Frontal Lobe | Inferior Frontal Gyrus | * | * | |
| 0.357 | 16 | 27 | 37 | 26 | -18 | 76 | 23.28 | -22.71 | 70.69 | * | * | * | * | * | |
| 0.369 | 14 | 26 | 36 | 34 | -22 | 72 | 30.85 | -26.34 | 66.88 | Right Cerebrum | Frontal Lobe | Precentral Gyrus | Gray Matter | Brodmann area 4 | |
| 0.416 | 5 | 22 | 30 | 70 | -38 | 48 | 64.93 | -40.41 | 44.46 | * | * | * | * | * | |
| 0.448 | 6 | 31 | 26 | 66 | -2 | 32 | 61.3 | -5.32 | 32.25 | Right Cerebrum | Frontal Lobe | Precentral Gyrus | White Matter | * | |
| 0.472 | 7 | 24 | 27 | 62 | -30 | 36 | 57.41 | -32.06 | 34.1 | Right Cerebrum | Parietal Lobe | Inferior Parietal Lobule | White Matter | * |

| Z | COORD SPACE | MNI SPACE | Talairach | Label | |||||||||||
| I | j | k | x | y | z | X coor | Y coor | Z coor | Level 1 | Level 2 | Level 3 | Level 4 | Level 5 | Appended Data | |
| 0.023 | 8 | 17 | 14 | 58 | -58 | -16 | 53.67 | -55.56 | -14.5 | Right Cerebrum | Temporal Lobe | Inferior Temporal Gyrus | Gray Matter | Brodmann area 20 | |
| 0.027 | 8 | 14 | 10 | 58 | -70 | -32 | 53.67 | -66 | -29.66 | Right Cerebellum | Posterior Lobe | Tuber | Gray Matter | * | |
| 0.043 | 36 | 18 | 14 | -54 | -54 | -16 | -52.32 | -50.83 | -14.85 | Left Cerebrum | Temporal Lobe | Inferior Temporal Gyrus | Gray Matter | Brodmann area 20 | |
| 0.182 | 21 | 49 | 17 | 6 | 70 | -4 | 4.86 | 65.51 | 3.94 | Inter-Hemispheric | * | * | * | * | |
| 0.432 | 17 | 50 | 17 | 22 | 74 | -4 | 20.01 | 69.17 | 4.27 | * | * | * | * | * | |
| 0.515 | 23 | 51 | 19 | -2 | 78 | 4 | -2.71 | 72.7 | 11.59 | * | * | * | * | * |

| Z | COORD SPACE | MNI SPACE | Talairach | Label | |||||||||||
| I | j | k | x | y | z | X coor | Y coor | Z coor | Level 1 | Level 2 | Level 3 | Level 4 | Level 5 | Appended Data | |
| 0.123 | 34 | 21 | 34 | -46 | -42 | 64 | -44.91 | -44.17 | 58.02 | * | * | * | * | * | |
| 0.123 | 7 | 26 | 25 | 62 | -22 | 28 | 57.46 | -24.02 | 27.39 | Right Cerebrum | Parietal Lobe | Inferior Parietal Lobule | White Matter | * | |
| 0.182 | 7 | 24 | 28 | 62 | -30 | 40 | 57.4 | -32.3 | 37.71 | Right Cerebrum | Parietal Lobe | Inferior Parietal Lobule | White Matter | * | |
| 0.222 | 6 | 17 | 25 | 66 | -58 | 28 | 61.12 | -58.17 | 25.19 | Right Cerebrum | Temporal Lobe | Superior Temporal Gyrus | White Matter | * | |
| 0.253 | 8 | 20 | 26 | 58 | -46 | 32 | 53.58 | -46.96 | 29.49 | Right Cerebrum | Parietal Lobe | Supramarginal Gyrus | Gray Matter | Brodmann area 40 | |
| 0.404 | 5 | 24 | 12 | 70 | -30 | -24 | 65.14 | -28.65 | -19.92 | * | * | * | * | * |

| Z | COORD SPACE | MNI SPACE | Talairach | Label | |||||||||||
| I | j | k | x | y | z | X coor | Y coor | Z coor | Level 1 | Level 2 | Level 3 | Level 4 | Level 5 | Appended Data | |
| 0.654 | 18 | 47 | 23 | 18 | 62 | 20 | 16.13 | 56.44 | 25.13 | Right Cerebrum | Frontal Lobe | Superior Frontal Gyrus | White Matter | * | |
| 0.702 | 38 | 31 | 25 | -62 | -2 | 28 | -59.82 | -4.03 | 27.96 | Left Cerebrum | Frontal Lobe | Precentral Gyrus | White Matter | * | |
| 0.753 | 35 | 35 | 19 | -50 | 14 | 4 | -48.35 | 12.43 | 7.39 | Left Cerebrum | Frontal Lobe | Precentral Gyrus | White Matter | * | |
| 0.777 | 35 | 30 | 28 | -50 | -6 | 40 | -48.51 | -8.62 | 38.59 | Left Cerebrum | Frontal Lobe | Precentral Gyrus | White Matter | * | |
| 0.805 | 34 | 34 | 30 | -46 | 10 | 48 | -44.69 | 6.05 | 46.81 | Left Cerebrum | Frontal Lobe | Middle Frontal Gyrus | White Matter | * | |
| 0.849 | 20 | 39 | 30 | 10 | 30 | 48 | 8.37 | 24.55 | 48.34 | Right Cerebrum | Frontal Lobe | Superior Frontal Gyrus | White Matter | * |

| Z | COORD SPACE | MNI SPACE | Talairach | Label | |||||||||||
| I | j | k | x | y | z | X coor | Y coor | Z coor | Level 1 | Level 2 | Level 3 | Level 4 | Level 5 | Appended Data | |
| 0.015 | 16 | 16 | 25 | 26 | -62 | 28 | 23.25 | -61.63 | 24.73 | Right Cerebrum | Temporal Lobe | Sub-Gyral | White Matter | * | |
| 0.015 | 4 | 34 | 21 | 74 | 10 | 12 | 68.97 | 7.14 | 15.01 | * | * | * | * | * | |
| 0.015 | 8 | 36 | 18 | 58 | 18 | 0 | 53.88 | 15.56 | 4.61 | Right Cerebrum | Frontal Lobe | Inferior Frontal Gyrus | * | * | |
| 0.023 | 8 | 38 | 18 | 58 | 26 | 0 | 53.91 | 23.14 | 5.1 | Right Cerebrum | Frontal Lobe | Inferior Frontal Gyrus | White Matter | * | |
| 0.198 | 5 | 34 | 26 | 70 | 10 | 32 | 65.13 | 6.02 | 33.01 | * | * | * | * | * | |
| 0.23 | 4 | 31 | 25 | 74 | -2 | 28 | 68.89 | -5.16 | 28.69 | * | * | * | * | * |


| Z | COORD SPACE | MNI SPACE | Talairach | Label | |||||||||||
| I | j | k | x | y | z | X coor | Y coor | Z coor | Level 1 | Level 2 | Level 3 | Level 4 | Level 5 | Appended Data | |
| 0.095 | 9 | 28 | 27 | 54 | -14 | 36 | 49.9 | -16.83 | 35.05 | Right Cerebrum | Frontal Lobe | Precentral Gyrus | White Matter | * |

| Z | COORD SPACE | MNI SPACE | Talairach | Label | |||||||||||
| I | j | k | x | y | z | X coor | Y coor | Z coor | Level 1 | Level 2 | Level 3 | Level 4 | Level 5 | Appended Data | |
| 0.142 | 19 | 11 | 21 | 14 | -82 | 12 | 11.87 | -79.56 | 9.02 | Right Cerebrum | Occipital Lobe | Cuneus | White Matter | * | |
| 0.218 | 18 | 11 | 23 | 18 | -82 | 20 | 15.64 | -80.06 | 16.24 | Right Cerebrum | Occipital Lobe | Cuneus | White Matter | * | |
| 0.253 | 41 | 26 | 16 | -74 | -22 | -8 | -71.16 | -20.8 | -5.77 | * | * | * | * | * | |
| 0.329 | 37 | 29 | 17 | -58 | -10 | -4 | -55.98 | -9.79 | -1.34 | Left Cerebrum | Temporal Lobe | Superior Temporal Gyrus | Gray Matter | Brodmann area 22 | |
| 0.583 | 10 | 20 | 25 | 50 | -46 | 28 | 46.02 | -46.67 | 25.84 | Right Cerebrum | Parietal Lobe | Inferior Parietal Lobule | White Matter | * | |
| 0.734 | 39 | 20 | 14 | -66 | -46 | -16 | -63.65 | -43.15 | -14.42 | Left Cerebrum | Temporal Lobe | Middle Temporal Gyrus | Gray Matter | Brodmann area 20 |

| Z | COORD SPACE | MNI SPACE | Talairach | Label | |||||||||||
| I | j | k | x | y | z | X coor | Y coor | Z coor | Level 1 | Level 2 | Level 3 | Level 4 | Level 5 | Appended Data | |
| 0.115 | 21 | 21 | 27 | 6 | -42 | 36 | 4.37 | -42.97 | 33.06 | Right Cerebrum | Limbic Lobe | Cingulate Gyrus | Gray Matter | Brodmann area 31 | |
| 0.146 | 19 | 17 | 20 | 14 | -58 | 8 | 11.96 | -56.58 | 6.89 | Right Cerebrum | Limbic Lobe | Posterior Cingulate | White Matter | * | |
| 0.186 | 16 | 15 | 22 | 26 | -66 | 16 | 23.27 | -64.73 | 13.67 | Right Cerebrum | Limbic Lobe | Posterior Cingulate | Gray Matter | Brodmann area 30 | |
| 0.202 | 16 | 17 | 22 | 26 | -58 | 16 | 23.3 | -57.15 | 14.16 | Right Cerebrum | Temporal Lobe | Sub-Gyral | White Matter | * | |
| 0.202 | 19 | 20 | 21 | 14 | -46 | 12 | 11.99 | -45.44 | 11.24 | Right Cerebrum | Limbic Lobe | Posterior Cingulate | White Matter | * | |
| 0.226 | 25 | 31 | 27 | -10 | -2 | 36 | -10.63 | -4.92 | 35.45 | Left Cerebrum | Limbic Lobe | Cingulate Gyrus | White Matter | * |

| Z | COORD SPACE | MNI SPACE | Talairach | Label | |||||||||||
| I | j | k | x | y | z | X coor | Y coor | Z coor | Level 1 | Level 2 | Level 3 | Level 4 | Level 5 | Appended Data | |
| 0.182 | 33 | 13 | 18 | -42 | -74 | 0 | -41.07 | -70.82 | -1.6 | Left Cerebrum | Temporal Lobe | Sub-Gyral | White Matter | * | |
| 0.19 | 20 | 14 | 10 | 10 | -70 | -32 | 8.24 | -65.6 | -29.91 | Right Cerebellum | Posterior Lobe | Uvula | Gray Matter | * | |
| 0.226 | 23 | 13 | 11 | -2 | -74 | -28 | -3.14 | -69.53 | -26.62 | Left Cerebellum | Posterior Lobe | Tuber of Vermis | Gray Matter | * | |
| 0.293 | 15 | 22 | 29 | 30 | -38 | 44 | 27.08 | -39.85 | 40.65 | Right Cerebrum | Parietal Lobe | Sub-Gyral | White Matter | * | |
| 0.353 | 26 | 27 | 22 | -14 | -18 | 16 | -14.42 | -18.9 | 16.42 | Left Cerebrum | Sub-lobar | Thalamus | Gray Matter | * | |
| 0.5 | 23 | 28 | 19 | -2 | -14 | 4 | -3.02 | -14.51 | 5.92 | Left Cerebrum | Sub-lobar | Thalamus | Gray Matter | Medial Dorsal Nucleus |

| Z | COORD SPACE | MNI SPACE | Talairach | Label | |||||||||||
| I | j | k | x | y | z | X coor | Y coor | Z coor | Level 1 | Level 2 | Level 3 | Level 4 | Level 5 | Appended Data | |
| 0.376 | 16 | 5 | 18 | 26 | -106 | 0 | 23.18 | -101.72 | -3.21 | * | * | * | * | * | |
| 0.384 | 14 | 6 | 20 | 34 | -102 | 8 | 30.74 | -98.46 | 4.28 | Right Cerebrum | Occipital Lobe | Middle Occipital Gyrus | * | * | |
| 0.42 | 33 | 21 | 35 | -42 | -42 | 68 | -41.14 | -44.43 | 61.64 | * | * | * | * | * | |
| 0.44 | 30 | 18 | 37 | -30 | -54 | 76 | -29.84 | -56.37 | 68.17 | * | * | * | * | * | |
| 0.507 | 27 | 19 | 37 | -18 | -50 | 76 | -18.47 | -52.68 | 68.48 | * | * | * | * | * | |
| 0.626 | 10 | 10 | 20 | 50 | -86 | 8 | 45.94 | -83.42 | 5.36 | Right Cerebrum | Occipital Lobe | Middle Occipital Gyrus | White Matter | * |

| Z | COORD SPACE | MNI SPACE | Talairach | Label | |||||||||||
| I | j | k | x | y | z | X coor | Y coor | Z coor | Level 1 | Level 2 | Level 3 | Level 4 | Level 5 | Appended Data | |
| 0.535 | 39 | 18 | 27 | -66 | -54 | 36 | -63.81 | -53.75 | 31.94 | * | * | * | * | * | |
| 0.607 | 42 | 25 | 20 | -78 | -26 | 8 | -73 | -25.49 | 8.38 | * | * | * | * | * | |
| 0.611 | 21 | 20 | 36 | 6 | -46 | 72 | 4.27 | -48.85 | 65.25 | Inter-Hemispheric | * | * | * | * | |
| 0.694 | 38 | 16 | 30 | -62 | -62 | 48 | -60.08 | -62.06 | 42.28 | * | * | * | * | * | |
| 0.757 | 23 | 17 | 36 | -2 | -58 | 72 | -3.35 | -60.16 | 64.47 | * | * | * | * | * | |
| 0.765 | 39 | 21 | 29 | -66 | -42 | 44 | -63.79 | -42.84 | 39.89 | * | * | * | * | * |

| Z | COORD SPACE | MNI SPACE | Talairach | Label | |||||||||||
| I | j | k | x | y | z | X coor | Y coor | Z coor | Level 1 | Level 2 | Level 3 | Level 4 | Level 5 | Appended Data | |
| 0.234 | 22 | 26 | 34 | 2 | -22 | 64 | 0.58 | -25.61 | 59.51 | Inter-Hemispheric | * | * | * | * | |
| 0.365 | 39 | 30 | 16 | -66 | -6 | -8 | -63.53 | -5.7 | -4.74 | Left Cerebrum | Temporal Lobe | Middle Temporal Gyrus | Gray Matter | Brodmann area 21 | |
| 0.38 | 20 | 15 | 34 | 10 | -66 | 64 | 8.01 | -67.38 | 56.83 | Right Cerebrum | Parietal Lobe | Superior Parietal Lobule | Gray Matter | Brodmann area 7 | |
| 0.404 | 16 | 9 | 14 | 26 | -90 | -16 | 23.27 | -85.62 | -16.64 | Right Cerebrum | Occipital Lobe | Fusiform Gyrus | * | * | |
| 0.551 | 34 | 32 | 18 | -46 | 2 | 0 | -44.6 | 1.25 | 3.07 | Left Cerebrum | Sub-lobar | Insula | Gray Matter | Brodmann area 13 | |
| 0.559 | 19 | 18 | 37 | 14 | -54 | 76 | 11.8 | -56.73 | 68.41 | * | * | * | * | * |


| Z | COORD SPACE | MNI SPACE | Talairach | Label | |||||||||||
| I | j | k | x | y | z | X coor | Y coor | Z coor | Level 1 | Level 2 | Level 3 | Level 4 | Level 5 | Appended Data | |
| 0.063 | 25 | 40 | 33 | -10 | 34 | 60 | -10.57 | 27.81 | 59.29 | * | * | * | * | * | |
| 0.063 | 12 | 35 | 33 | 42 | 14 | 60 | 38.57 | 8.42 | 58.33 | * | * | * | * | * | |
| 0.087 | 13 | 38 | 32 | 38 | 26 | 56 | 34.84 | 20.06 | 55.45 | Right Cerebrum | Frontal Lobe | Middle Frontal Gyrus | Gray Matter | Brodmann area 6 | |
| 0.111 | 33 | 32 | 34 | -42 | 2 | 64 | -40.98 | -2.49 | 60.75 | * | * | * | * | * | |
| 0.162 | 15 | 40 | 32 | 30 | 34 | 56 | 27.29 | 27.71 | 55.9 | Right Cerebrum | Frontal Lobe | Middle Frontal Gyrus | * | * | |
| 0.206 | 14 | 34 | 32 | 34 | 10 | 56 | 31 | 4.92 | 54.44 | Right Cerebrum | Frontal Lobe | Middle Frontal Gyrus | White Matter | * |

| Z | COORD SPACE | MNI SPACE | Talairach | Label | |||||||||||
| I | j | k | x | y | z | X coor | Y coor | Z coor | Level 1 | Level 2 | Level 3 | Level 4 | Level 5 | Appended Data | |
| 0.567 | 33 | 42 | 25 | -42 | 42 | 28 | -40.75 | 37.51 | 30.79 | Left Cerebrum | Frontal Lobe | Superior Frontal Gyrus | Gray Matter | Brodmann area 9 | |
| 0.567 | 13 | 23 | 19 | 38 | -34 | 4 | 34.77 | -33.8 | 4.9 | Right Cerebrum | Temporal Lobe | Sub-Gyral | White Matter | * | |
| 0.571 | 5 | 24 | 27 | 70 | -30 | 36 | 64.98 | -32.13 | 34.14 | Right Cerebrum | Parietal Lobe | Inferior Parietal Lobule | Gray Matter | Brodmann area 40 | |
| 0.575 | 7 | 23 | 29 | 62 | -34 | 44 | 57.38 | -36.32 | 41.06 | Right Cerebrum | Parietal Lobe | Inferior Parietal Lobule | Gray Matter | Brodmann area 40 | |
| 0.611 | 15 | 24 | 19 | 30 | -30 | 4 | 27.21 | -29.94 | 5.1 | Right Cerebrum | Sub-lobar | Extra-Nuclear | White Matter | * | |
| 0.761 | 39 | 30 | 26 | -66 | -6 | 32 | -63.63 | -8.02 | 31.3 | Left Cerebrum | Frontal Lobe | Precentral Gyrus | Gray Matter | Brodmann area 6 |

| Z | COORD SPACE | MNI SPACE | Talairach | Label | |||||||||||
| I | j | k | x | y | z | X coor | Y coor | Z coor | Level 1 | Level 2 | Level 3 | Level 4 | Level 5 | Appended Data | |
| 0.115 | 8 | 33 | 26 | 58 | 6 | 32 | 53.76 | 2.33 | 32.7 | Right Cerebrum | Frontal Lobe | Precentral Gyrus | Gray Matter | Brodmann area 6 | |
| 0.126 | 4 | 24 | 28 | 74 | -30 | 40 | 68.76 | -32.4 | 37.77 | * | * | * | * | * | |
| 0.154 | 33 | 20 | 29 | -42 | -46 | 44 | -41.09 | -46.83 | 39.77 | Left Cerebrum | Parietal Lobe | Inferior Parietal Lobule | Gray Matter | Brodmann area 40 | |
| 0.158 | 35 | 19 | 30 | -50 | -50 | 48 | -48.68 | -50.79 | 43.09 | Left Cerebrum | Parietal Lobe | Inferior Parietal Lobule | Gray Matter | Brodmann area 40 | |
| 0.158 | 33 | 19 | 26 | -42 | -50 | 32 | -41.07 | -49.93 | 28.71 | Left Cerebrum | Parietal Lobe | Supramarginal Gyrus | White Matter | * | |
| 0.158 | 8 | 33 | 24 | 58 | 6 | 24 | 53.78 | 2.79 | 25.49 | Right Cerebrum | Frontal Lobe | Inferior Frontal Gyrus | Gray Matter | Brodmann area 9 |

| Z | COORD SPACE | MNI SPACE | Talairach | Label | |||||||||||
| I | j | k | x | y | z | X coor | Y coor | Z coor | Level 1 | Level 2 | Level 3 | Level 4 | Level 5 | Appended Data | |
| 0.031 | 33 | 30 | 35 | -42 | -6 | 68 | -41.01 | -10.31 | 63.86 | * | * | * | * | * | |
| 0.035 | 17 | 30 | 36 | 22 | -6 | 72 | 19.55 | -11.07 | 67.81 | Right Cerebrum | Frontal Lobe | Superior Frontal Gyrus | Gray Matter | Brodmann area 6 | |
| 0.035 | 13 | 15 | 17 | 38 | -66 | -4 | 34.68 | -63.67 | -4.29 | Right Cerebrum | Occipital Lobe | Sub-Gyral | White Matter | * | |
| 0.055 | 21 | 22 | 30 | 6 | -38 | 48 | 4.36 | -39.88 | 44.12 | Right Cerebrum | Parietal Lobe | Precuneus | Gray Matter | Brodmann area 7 | |
| 0.075 | 25 | 17 | 32 | -10 | -58 | 56 | -10.87 | -59.17 | 50.01 | Left Cerebrum | Parietal Lobe | Precuneus | White Matter | * | |
| 0.079 | 20 | 7 | 23 | 10 | -98 | 20 | 8.01 | -95.16 | 15.21 | Right Cerebrum | Occipital Lobe | Middle Occipital Gyrus | Gray Matter | Brodmann area 18 |

| Z | COORD SPACE | MNI SPACE | Talairach | Label | |||||||||||
| I | j | k | x | y | z | X coor | Y coor | Z coor | Level 1 | Level 2 | Level 3 | Level 4 | Level 5 | Appended Data | |
| 0.309 | 26 | 37 | 21 | -14 | 22 | 12 | -14.27 | 19.25 | 15.28 | Left Cerebrum | Sub-lobar | Lateral Ventricle | Cerebro-Spinal Fluid | * | |
| 0.321 | 19 | 33 | 16 | 14 | 6 | -8 | 12.22 | 5.01 | -3.58 | Right Cerebrum | Sub-lobar | Lentiform Nucleus | Gray Matter | Lateral Globus Pallidus | |
| 0.349 | 19 | 46 | 21 | 14 | 58 | 12 | 12.35 | 53.14 | 17.65 | Right Cerebrum | Frontal Lobe | Medial Frontal Gyrus | White Matter | * | |
| 0.357 | 17 | 36 | 14 | 22 | 18 | -16 | 19.86 | 16.78 | -10 | Right Cerebrum | Sub-lobar | Extra-Nuclear | White Matter | * | |
| 0.361 | 31 | 46 | 18 | -34 | 58 | 0 | -33.05 | 54.24 | 6.59 | Left Cerebrum | Frontal Lobe | Middle Frontal Gyrus | White Matter | * | |
| 0.373 | 22 | 37 | 21 | 2 | 22 | 12 | 0.87 | 19.12 | 15.37 | Inter-Hemispheric | * | * | White Matter | Corpus Callosum |

| Z | COORD SPACE | MNI SPACE | Talairach | Label | |||||||||||
| I | j | k | x | y | z | X coor | Y coor | Z coor | Level 1 | Level 2 | Level 3 | Level 4 | Level 5 | Appended Data | |
| 0.238 | 25 | 25 | 32 | -10 | -26 | 56 | -10.77 | -28.83 | 51.99 | Left Cerebrum | Frontal Lobe | Paracentral Lobule | White Matter | * | |
| 0.246 | 26 | 21 | 28 | -14 | -42 | 40 | -14.56 | -43.04 | 36.56 | Left Cerebrum | Limbic Lobe | Precuneus | White Matter | * | |
| 0.305 | 29 | 24 | 36 | -26 | -30 | 72 | -25.96 | -33.42 | 66.07 | Left Cerebrum | Parietal Lobe | Postcentral Gyrus | White Matter | * | |
| 0.424 | 19 | 23 | 33 | 14 | -34 | 60 | 11.91 | -36.85 | 55.22 | Right Cerebrum | Frontal Lobe | Paracentral Lobule | White Matter | * | |
| 0.634 | 17 | 22 | 35 | 22 | -38 | 68 | 19.45 | -41.17 | 62.23 | Right Cerebrum | Parietal Lobe | Sub-Gyral | White Matter | * | |
| 0.781 | 29 | 20 | 34 | -26 | -46 | 64 | -24 | -48.12 | 57.88 | Left Cerebrum | Parietal Lobe | Sub-Gyral | White Matter | * |

| Z | COORD SPACE | MNI SPACE | Talairach | Label | |||||||||||
| I | j | k | x | y | z | X coor | Y coor | Z coor | Level 1 | Level 2 | Level 3 | Level 4 | Level 5 | Appended Data | |
| 0.698 | 26 | 37 | 24 | -14 | 22 | 24 | -14.31 | 18.55 | 26.1 | Left Cerebrum | Limbic Lobe | Cingulate Gyrus | White Matter | * | |
| 0.702 | 21 | 30 | 30 | 6 | -6 | 48 | 4.47 | -9.55 | 46.1 | Right Cerebrum | Limbic Lobe | Paracentral Lobule | * | * | |
| 0.742 | 12 | 21 | 31 | 42 | -42 | 52 | 38.4 | -44.2 | 47.67 | Right Cerebrum | Parietal Lobe | Inferior Parietal Lobule | Gray Matter | Brodmann area 40 | |
| 0.773 | 12 | 30 | 36 | 42 | -6 | 72 | 38.47 | -11.24 | 67.91 | * | * | * | * | * | |
| 0.809 | 31 | 20 | 28 | -34 | -46 | 40 | -33.51 | -46.67 | 36.21 | Left Cerebrum | Parietal Lobe | Sub-Gyral | White Matter | * | |
| 0.849 | 17 | 22 | 19 | 22 | -38 | 4 | 19.61 | -37.46 | 4.56 | Right Cerebrum | Limbic Lobe | Parahippocampal Gyrus | White Matter | * |

| Z | COORD SPACE | MNI SPACE | Talairach | Label | |||||||||||
| I | j | k | x | y | z | X coor | Y coor | Z coor | Level 1 | Level 2 | Level 3 | Level 4 | Level 5 | Appended Data | |
| 0.091 | 19 | 31 | 19 | 14 | -2 | 4 | 12.16 | -3.27 | 6.74 | Right Cerebrum | Sub-lobar | Thalamus | Gray Matter | * | |
| 0.091 | 28 | 26 | 18 | -22 | -22 | 0 | -21.96 | -21.7 | 1.71 | Left Cerebrum | Sub-lobar | Extra-Nuclear | White Matter | * | |
| 0.099 | 27 | 26 | 20 | -18 | -22 | 8 | -18.2 | -22.19 | 8.94 | Left Cerebrum | Sub-lobar | Thalamus | Gray Matter | Ventral Posterior Medial Nucleus | |
| 0.103 | 25 | 24 | 17 | -10 | -30 | -4 | -10.62 | -29.15 | -2.32 | Left Brainstem | Midbrain | * | * | * | |
| 0.103 | 27 | 20 | 10 | -18 | -46 | -32 | -18.18 | -42.62 | -28.58 | Left Cerebellum | Anterior Lobe | * | Gray Matter | * | |
| 0.119 | 30 | 26 | 23 | -30 | -22 | 20 | -29.59 | -22.79 | 19.69 | Left Cerebrum | Sub-lobar | Insula | White Matter | * |

| Z | COORD SPACE | MNI SPACE | Talairach | Label | |||||||||||
| I | j | k | x | y | z | X coor | Y coor | Z coor | Level 1 | Level 2 | Level 3 | Level 4 | Level 5 | Appended Data | |
| 0.619 | 19 | 43 | 10 | 14 | 46 | -32 | 12.42 | 44.32 | -22.73 | Right Cerebrum | Frontal Lobe | Sub-Gyral | White Matter | * | |
| 0.642 | 22 | 38 | 11 | 2 | 26 | -28 | 0.99 | 25.23 | -20.42 | Inter-Hemispheric | * | * | * | * | |
| 0.646 | 23 | 11 | 15 | -2 | -82 | -12 | -3.21 | -78.04 | -12.69 | Left Cerebellum | Posterior Lobe | Declive | Gray Matter | * | |
| 0.746 | 22 | 41 | 10 | 2 | 38 | -32 | 1.04 | 36.84 | -23.29 | Inter-Hemispheric | * | * | * | * | |
| 0.825 | 10 | 14 | 23 | 50 | -70 | 20 | 45.96 | -68.95 | 17.15 | Right Cerebrum | Occipital Lobe | Middle Temporal Gyrus | White Matter | * | |
| 0.888 | 26 | 45 | 15 | -14 | 54 | -12 | -14.1 | 50.97 | -4.37 | Left Cerebrum | Frontal Lobe | Medial Frontal Gyrus | Gray Matter | Brodmann area 10 |

| Z | COORD SPACE | MNI SPACE | Talairach | Label | |||||||||||
| I | j | k | x | y | z | X coor | Y coor | Z coor | Level 1 | Level 2 | Level 3 | Level 4 | Level 5 | Appended Data | |
| 0.353 | 10 | 44 | 18 | 50 | 50 | 0 | 46.42 | 45.96 | 6.54 | Right Cerebrum | Frontal Lobe | Middle Frontal Gyrus | Gray Matter | Brodmann area 46 | |
| 0.353 | 13 | 42 | 15 | 38 | 42 | -12 | 35.07 | 39.17 | -4.83 | Right Cerebrum | Frontal Lobe | Middle Frontal Gyrus | White Matter | * | |
| 0.392 | 15 | 36 | 26 | 30 | 18 | 32 | 27.3 | 13.93 | 33.29 | Right Cerebrum | Frontal Lobe | Sub-Gyral | White Matter | * | |
| 0.436 | 17 | 40 | 23 | 22 | 34 | 20 | 19.82 | 29.86 | 23.42 | Right Cerebrum | Limbic Lobe | Anterior Cingulate | White Matter | * | |
| 0.492 | 21 | 46 | 12 | 6 | 58 | -24 | 4.87 | 55.3 | -14.83 | Right Cerebrum | Frontal Lobe | Medial Frontal Gyrus | Gray Matter | Brodmann area 11 | |
| 0.638 | 18 | 38 | 23 | 18 | 26 | 20 | 16 | 22.31 | 22.91 | Right Cerebrum | Limbic Lobe | Anterior Cingulate | White Matter | * |


| Z | COORD SPACE | MNI SPACE | Talairach | Label | |||||||||||
| I | j | k | x | y | z | X coor | Y coor | Z coor | Level 1 | Level 2 | Level 3 | Level 4 | Level 5 | Appended Data | |
| 0.035 | 26 | 48 | 22 | -14 | 66 | 16 | -14.13 | 60.73 | 21.6 | Left Cerebrum | Frontal Lobe | Superior Frontal Gyrus | Gray Matter | Brodmann area 10 | |
| 0.047 | 26 | 47 | 20 | -14 | 62 | 8 | -14.13 | 57.4 | 14.15 | Left Cerebrum | Frontal Lobe | Superior Frontal Gyrus | White Matter | * |