wiki
Fall 2011
OVERVIEW
I am hopeful to have a project that combines imaging with genetics, possibly applied to ASDs, however since the quarter does not start until the end of September, for now I am focusing on the very cool task of producing voxelwise labeled group results for online query and crosswise comparison.
JANUARY 2
Goal: To take a “bag” of individual functional networks (25 per person), assign labels in an unsupervised manner, and then use labels to train a classifier. At the end of the day we should be able to throw in a new network, and have the classifier tell us other networks that it looks most like.
Algorithm overview
1) calculate pairwise match scores for all functional networks (perhaps filtering out noise based on high frequency first?) 2) determine the “best” matches based on some threshold criteria 3) group matches and assign label based on groupings 4) THEN extract AAL specific markers to look at, use these markers with labels for supervised clustering
STEP 1: Pairwise match scores
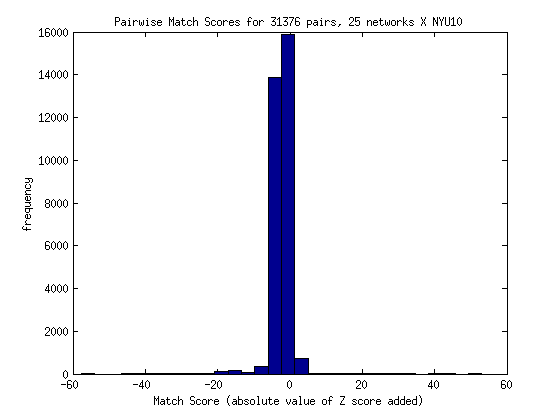
For a set of thresholded Z score images, I decided to calculate pairwise matching scores, based on the following formula:
difference_score = average_activation_per_voxel_shared - average_activation_per_voxel_notshared
A higher score indicates that the two images have more overlap, and for that overlap, the activation was more significant. Within this method, there are two forms of the scoring equation. The first takes the absolute value of the Z score, meaning that a value of -5 is treated with the same magnitude as a 5, and they don’t cancel each other out:
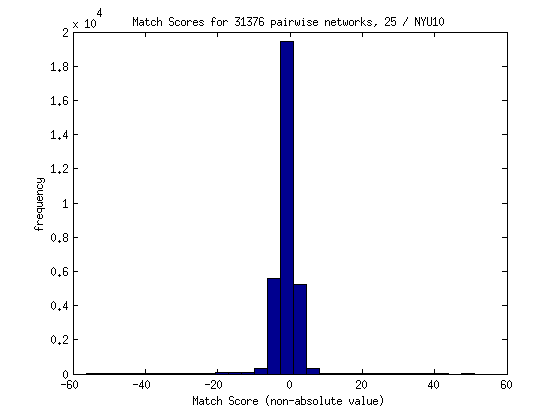
The second does not take the absolute value:
This approach has two potential problems:
- 1) With different ICA runs, the directions / magnitudes of the eigenvectors are not comparable between people. This makes sense, and I wonder if this means that the algorithm should look at overlap instead of Z values.
- 2) Not symmetrical! I was calculating each score for images A –> B, but not from B –> A. It occurred to me that since one image is used as a template and the other has the Z values extracted, the scores would be different from A –> B and B –> A.
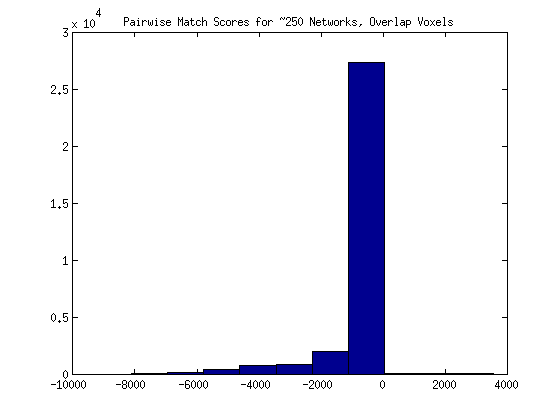
As a proposed solution the matching score might be changed to reflect the Z scores from both images, OR we might do away with activation, and simply calculate shared voxels - unshared voxels. For the next method, I decided to try doing a simple count of the overlap. If two images both had a Z score value not equal to 0 for any given voxel, I added one to the count. If either image had a voxel without activation in the other image, I subtracted one point. Not surprisingly, the distribution for 250 images looks as follows (with mostly high negative scores):
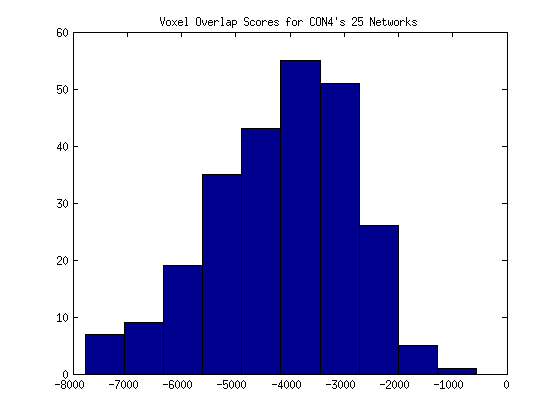
and it may be more correct to look at the distribution for one individual’s networks:
Realizing that total counts were probably not comparable to one another, (for example, 400 voxels might be a smaller number shared in one set of images than another set) I decided to instead calculate the overlap as a % of all area that isn’t zero between both images.
# First I set the total voxel count equal to the length of the index of voxels for one image
activation_vox_count = len(coordsRCP)

# I then use this list to count overlapping voxels between this image and the second.
# Each time I find overlap, I add one point to "activation_shared)
activation_shared = activation_shared + 1

# I then go through the second image, and zero the voxels (from the index) that I've counted.
# Remaining voxels represent activation in the second image not in the first.
# I add these voxels to the "activation_vox_count"
activation_vox_count = activation_vox_count + 1
In summary, the activation_vox_count is the number of voxels of total activation shared between the images, not counting overlapping areas twice. The activation_shared is only the overlapping voxels. I can now calculate an overlap score with these two values:
activation_overlap[com.name] = float(activation_shared) / activation_vox_count
Here is the new distribution:
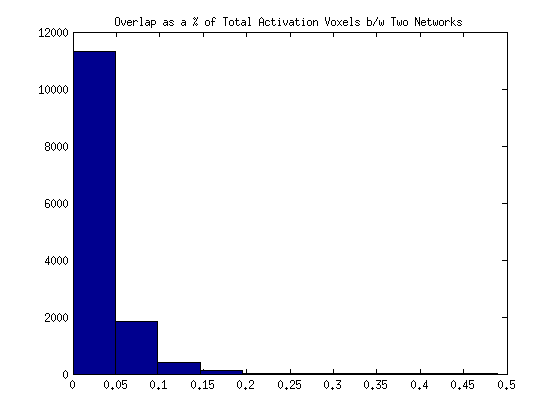
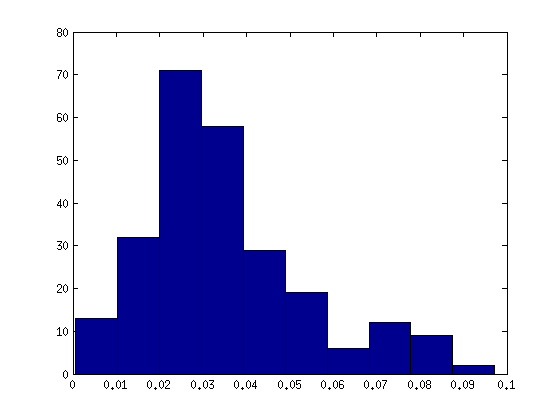
…and the distribution for just one individual’s 25 networks:
STEP 2: Threshold Criteria
It might make sense to set the threshold at 0, since any value greater than zero means that there is more shared activation than unshared. However, in the case that this produces too many networks, I’ve been thinking about how to best threshold results. The number of “real” matches is going to depend on the number of people involved, and the number of networks we might think to actually exist. When we get an idea of how many networks that should be, we need to figure out how many standard deviations will produce that many, and then calculate the threshold from that:
threshold = mean(data) + (STATS.sd * 2.5);
STEP 3: Group Matches
Some type of network / graph analysis might do a good job of visualizing / grouping these results. For preliminary data, I hijacked Cytoscape and made input files for my networks to mirror the protein input files we used in BMI214. Cytoscape probably isn’t the best way to be working with the data… I need to find a better way.
STEP 4: Extract AAL markers for vector in supervised clustering I then want to, for each of the functional networks in the graph above, extract AAL activation scores for each (which I already have a script to do, and moved in this direction when I realized I didn’t have labels) and use those AAL scores as features in a supervised learning method to classify these networks. The labels determined in step 3 of course will be used for training.
DECEMBER 2
Meeting for Friday
1) Rotation update 2) Data Update 3) Cool things working on - making script to create “feature” vectors for functional networks - extracting a “score” for each AAL region based on the average Z score per voxel within the region, and then clustering.
FUNCTIONAL NETWORK CLUSTERING
The GOAL is to compare functional networks across disorder. I will approach this in two ways to address group networks, and then individual networks.
preprocess –> individual networks –> filter –> featurize –> cluster
GROUP NETWORKS
I will 1) process group networks for JUST one group at a time (ADHD, control, etc), 2) filter out noisy images, and 3) extract a vector of features from each group functional network, cluster the features, and map on network types and disorder to look for trends. The “feature vector” will consist of scores based on average Z score / voxel for each of the regions in the AAL atlas. I would expect to see networks of similar types cluster together across disorder, and it will be interesting to see if any disorders have networks that fall in a different cluster.
Question 1: It is my understanding that efforts should be made so that features are not correlated (independent features). With this in mind, I am looking at average activation per region as opposed to weighing by salience in image (multiplying by total Z in aal / total Z in image)
Question 2: It also makes sense to use the Z score maps, as opposed to getting some sort of average activation?
INDIVIDUAL NETWORKS
This approach could be a lot more powerful (and we have a lot more networks to look at) if done at the individual level. In this case I can 1) process individual networks AND group networks for one group at a time.
2) Filter out noise from group networks (and individual?),
3) Does it make sense to use top match for each individual network to the group network to get rid of noisy ones?
4) extract features from individual networks
5) cluster networks, look for significant groupings of networks, age groups, and other variables
With this approach we can also do classification - either providing the disorder as a label or the age / network, and try kmeans to see how well it works. I can try simple algorithms in weka, or use glmnet in R.
SEPTEMBER 16
After running a pyMatch test for NYU10 and NYUALL and seeing results that didn’t seem to visually be the “best” matches, I have decided to re-examine the application of the algorithm. The first application was matching individual networks (with positive and negative activation) to group networks (also with positive and negative activation). Now we are matching a statistical image (a gray matter image result) to a dual regression result (representing significant differences between ADHD and control) that ONLY has positive values.
pyMatch Applied to GM result and DR results for NYUALL
After looking at the top matches for NYUALL using the doTemplateMatching algorithm, I am still unhappy with the method (sorry!) The top three reported matches were:


For these matches - they don’t have shared voxels! If we look at the complete results, it is clear that the top three matches were chosen because they had an average activation in unshared voxels with a value greater than 0, so when we subtract that from average activation per voxel shared and take the absolute value, it comes out on top.
Component 2:
dr_stage3_ic0001_tfce_corrp_tstat1 mean activation/voxel within template is 0.00559999998659
dr_stage3_ic0001_tfce_corrp_tstat1 mean activation/voxel outside of template is 0.258957960006
dr_stage3_ic0001_tfce_corrp_tstat1 activation difference score: -0.25335796002
dr_stage3_ic0001_tfce_corrp_tstat1 absolute activation difference score: 0.25335796002

Component 1:
Calculating shared and unshared activation per voxel for each contender image...
dr_stage3_ic0000_tfce_corrp_tstat1 does not have voxels with activation within template.
dr_stage3_ic0000_tfce_corrp_tstat1 mean activation/voxel outside of template is 0.200813255957
dr_stage3_ic0000_tfce_corrp_tstat1 activation difference score: -0.200813255957
dr_stage3_ic0000_tfce_corrp_tstat1 absolute activation difference score: 0.200813255957

Component 9:
dr_stage3_ic0008_tfce_corrp_tstat1 does not have voxels with activation within template.
dr_stage3_ic0008_tfce_corrp_tstat1 mean activation/voxel outside of template is 0.163799998401
dr_stage3_ic0008_tfce_corrp_tstat1 activation difference score: -0.163799998401
dr_stage3_ic0008_tfce_corrp_tstat1 absolute activation difference score: 0.163799998401
This is not a good algorithm to look for tiny regions that match with huge networks, because it is ranking networks higher that have zero overlap! Visually looking at the results, I would say that we might see the following components as best “matching” our result:


Minimally, I can see some overlap. Component 21 seems to have completely eaten the GM result, so I definitely would expect to see it in the top three. Now let’s look at the raw scores for these components, with the doTemplateMatching algorithm:
Component 10
dr_stage3_ic0009_tfce_corrp_tstat1 mean activation/voxel within template is 0.110660099744
dr_stage3_ic0009_tfce_corrp_tstat1 mean activation/voxel outside of template is 0.144742678705
dr_stage3_ic0009_tfce_corrp_tstat1 activation difference score: -0.0340825789608
dr_stage3_ic0009_tfce_corrp_tstat1 absolute activation difference score: 0.0340825789608

Component 21
dr_stage3_ic0020_tfce_corrp_tstat1 mean activation/voxel within template is 0.0736999992514
dr_stage3_ic0020_tfce_corrp_tstat1 mean activation/voxel outside of template is 0.0772391486465
dr_stage3_ic0020_tfce_corrp_tstat1 activation difference score: -0.00353914939511
dr_stage3_ic0020_tfce_corrp_tstat1 absolute activation difference score: 0.00353914939511

Component 25
dr_stage3_ic0024_tfce_corrp_tstat1 mean activation/voxel within template is 0.00669767453638
dr_stage3_ic0024_tfce_corrp_tstat1 mean activation/voxel outside of template is 0.0274407815368
dr_stage3_ic0024_tfce_corrp_tstat1 activation difference score: -0.0207431070004
dr_stage3_ic0024_tfce_corrp_tstat1 absolute activation difference score: 0.0207431070004
Matter of fact, only five of the 25 have any overlap at all (ranked by mean activation / voxel):
COM10: dr_stage3_ic0009_tfce_corrp_tstat1 mean activation/voxel within template is 0.110660099744
COM21: dr_stage3_ic0020_tfce_corrp_tstat1 mean activation/voxel within template is 0.0736999992514
COM25: dr_stage3_ic0024_tfce_corrp_tstat1 mean activation/voxel within template is 0.00669767453638
COM02: dr_stage3_ic0001_tfce_corrp_tstat1 mean activation/voxel within template is 0.00559999998659
COM16: dr_stage3_ic0015_tfce_corrp_tstat1 mean activation/voxel within template is 0.00200000009499
I think that this might be an application issue - the doTemplateMatching wants to match everything exactly (subtracting points for activation outside the template), however for our purposes, we want to just maximize overlap, and it’s ok if our little piece doesn’t fit the entire picture, as long as the picture best fits our little piece. Given that we care most about the overlap, perhaps we might want to just look at mean activation per voxel shared? If we also want to “take points away” for activation outside the mask, then I think we should take the absolute value of the activation when we calculate the mean / voxel shared and unshared, and then we wouldn’t run into the problem above, because we would be subtracting a larger value from 0, and that wouldn’t get ranked higher than a positive value!
MODIFICATION OF ALGORITHM IN MRTOOLS
First I will modify the algorithm only slightly to try and still account for activation outside of the template. I will add a method called doTemplateMatchingV to the Match class in MRtools to test - the following algorithm takes the absolute value of average activation/voxel shared, and subtracts the absolute value of average activation not shared. Since we don’t have negative Z values in these maps, we can expect that the absolute value scores will be equivalent to the relative ones. The only difference between this algorithm and the one above is when the absolute value is taken. Below, we take it when calculating average activation / voxel. Above, we take the absolute value after calculating the difference. Full results can be seen here and the top three matches are:


Component 21
dr_stage3_ic0020_tfce_corrp_tstat1 mean activation/voxel within template is 0.0736999992514
dr_stage3_ic0020_tfce_corrp_tstat1 absolute activation/voxel within template used for scoring is 0.0736999992514
dr_stage3_ic0020_tfce_corrp_tstat1 mean activation/voxel outside of template is 0.0772391486465
dr_stage3_ic0020_tfce_corrp_tstat1 absolute activation/voxel outside of template used for scoring is 0.0772391486465
dr_stage3_ic0020_tfce_corrp_tstat1 activation difference score: -0.00353914939511
dr_stage3_ic0020_tfce_corrp_tstat1 absolute activation difference score: -0.00353914939511

Component 24
dr_stage3_ic0023_tfce_corrp_tstat1 does not have voxels with activation within template.
dr_stage3_ic0023_tfce_corrp_tstat1 mean activation/voxel outside of template is 0.0107380953601
dr_stage3_ic0023_tfce_corrp_tstat1 absolute activation/voxel outside of template used for scoring is 0.0107380953601
dr_stage3_ic0023_tfce_corrp_tstat1 activation difference score: -0.0107380953601
dr_stage3_ic0023_tfce_corrp_tstat1 absolute activation difference score: -0.0107380953601

Component 18
dr_stage3_ic0017_tfce_corrp_tstat1 does not have voxels with activation within template.
dr_stage3_ic0017_tfce_corrp_tstat1 mean activation/voxel outside of template is 0.0158059702988
dr_stage3_ic0017_tfce_corrp_tstat1 absolute activation/voxel outside of template used for scoring is 0.0158059702988
dr_stage3_ic0017_tfce_corrp_tstat1 activation difference score: -0.0158059702988
dr_stage3_ic0017_tfce_corrp_tstat1 absolute activation difference score: -0.0158059702988
We can confirm that the calculation of raw activation/voxel within template is the same, this only would have been different given that there were negative activations somewhere in there…
dr_stage3_ic0009_tfce_corrp_tstat1 mean activation/voxel within template is 0.110660099744
dr_stage3_ic0020_tfce_corrp_tstat1 mean activation/voxel within template is 0.0736999992514
dr_stage3_ic0024_tfce_corrp_tstat1 mean activation/voxel within template is 0.00669767453638
dr_stage3_ic0001_tfce_corrp_tstat1 mean activation/voxel within template is 0.00559999998659
dr_stage3_ic0015_tfce_corrp_tstat1 mean activation/voxel within template is 0.00200000009499
While this method did slightly better, and the top match (component 21) as determined by the algorithm is visually a top two match as well, it is troubling that two components without any shared activation get better scores. To figure out why, let’s look at the scores for what I would consider, visually, the top match - component 10.
dr_stage3_ic0009_tfce_corrp_tstat1 mean activation/voxel within template is 0.110660099744
dr_stage3_ic0009_tfce_corrp_tstat1 absolute activation/voxel within template used for scoring is 0.110660099744
dr_stage3_ic0009_tfce_corrp_tstat1 mean activation/voxel outside of template is 0.144742678705
dr_stage3_ic0009_tfce_corrp_tstat1 absolute activation/voxel outside of template used for scoring is 0.144742678705
dr_stage3_ic0009_tfce_corrp_tstat1 activation difference score: -0.0340825789608
dr_stage3_ic0009_tfce_corrp_tstat1 absolute activation difference score: -0.0340825789608
The issue is that there was also robust activation outside of the template, and when we subtracted this from the mean activation within the template, they canceled each other out well enough so that the activation difference score (-0.03) didn’t beat the scores from components with activation only outside the template, namely 24(-0.01) and 18(-0.015)
HOW TO BEST MATCH?
For these dual regression components, I would like to suggest based on the above that we focus on the overlap, and do not look at activation outside of the template. I am interested to hear what others think! If we use this as our algorithm, the “top ranked matches” would be as follows:
SEPTEMBER 13
What I have done
- Created module to perform simple image reading MRTools.py filtering, matching (SECTION 1- MRtools)
- Created scripts that use this module do command line filtering and matching pyMatch.py and melodic_hp.py
- Created python script (also using MRtools) to create AIM xml file from input image AIMTemp.py SECTION 2- pyMatch and melodic_hp and AIMTemp.py)
- Modified ica+ to use pyMatch, melodic_hp, and AIMTemp to do filtering of group networks, matching to template, and AIM xml generation (SECTION 3- OVERVIEW OF ICA+)
- Testing of melodic_hp outside of ica+ Package (SECTION 4- TESTING melodic_hp)
- Testing of pyMatch.py outside of ica+ Package SECTION 5- TESTING pyMatch.py)
- Testing of AIMTemp.py with top matched results (SECTION 6- TESTING AIMTemp.py)
What I am working on
Installing python with numpy / scipy / nibabel on cluster.
What I want to do next / Questions
- Review top matches and xml output
- do we want to spit out the top three results (as currently is) or have a threshold?
- do we want to add additional meta data from image or user to the xml? info from NeuroLex?
- Get python installation working on cluster, test scripts with ica+ OR download NYUALL group results on local machine
- Do filtering, matching, and aimify of NYUALL results
- Put AIM xml into database (Brian?) and concurrently
- review pipeline with K, and when good, ica+ process other ADHD datasets
- produce XML for ALL datasets to put into database, with grant deadline in mind
- then look at results, do write up of results
- When I took the absolute value of the IC networks in an effort to run a dual regression that captured deactivations and activations, the resulting dual regression looked very similar to the original with just positive activations. ;Should we either stick with the ADHD ; Control contrast only (the activations) or do some other sort of combination of contrast images?
SECTION 1 - MRTOOLS - python module for image reading, filtering, matching=====
Given that I forsee needing to achieve this functionality for many different applications across my graduate career, I decided that I wanted to create a module that would do matching, filtering, and reading / looking up coordinates and values that might be applied to many different things. I separated the functionality to read in an image and look up coordinates from pyCorr (which did the template matching) and created a python module called MRTools.py, which has the following classes and functions:
- MRtools.Data: Translate between images of different dimensions and formats
- MRtools.Filter: Determine goodness of an input image and a frequency timeseries
- MRtools.Match: Return match score for two MRtools Data objects
Sample usage for..
Data class:
>>import MRtools
>>Image = Mrtools.Data('myimage.nii.gz')
>>Image.mritoRCP([x,y,z])
>>Image.rcptoMNI([x,y,z])

Filter class:
>>import MRtools
>>Image = MRtools.Data('myimage.nii.gz')
>>Filter = Mrtrans.Filter()
>>Filter.isGood(Image,'timeseries.txt','frequency.txt')

Match class:
>>import MRtools
>>Template = Mrtools.Data('myimage.nii.gz','/path/to/ts.txt')
>>Match = MRtools.Match(Template)
>>Match.setIndexCrit(";",0)

>>Image = MRtools.Data('imagetomatch.nii.gz')
>>Match.getSharedVox(Image)
>>Match.getDifferenceScore(Image)
SECTION 2 - ICA+ SCRIPTS THAT UTILIZE MR TOOLS (pyMatch and melodic_hp)=====
For the ica+ pipeline, I then created the following scripts that use MRtools to accomplish their goals. All scripts use the MRtools Data object to read in images and compare across spaces, and return activation values, if necessary. In addition:
- pyMatch.py: uses MRtools Match object to match a list of input images to a specified template –> outputs match scores with image lists
- melodic_hp.py: uses MRtools Filter object to perform high pass filtering on a folder of images –> outputs lists of “good” images
- AIMTemp.py uses the MRtools Data object to read in images, compare across spaces –> outputs AIM xml file
The scripts above can be run alone on the command line to achieve desired functionality, or run to work specifically with the ica+ package to work with dual regression and IC network results. pyMatch and melodic_hp each take in entire lists of images, as the goal is to output one cohesive result, however AIMTemp.py is submit by ica+ in a batch fashion to produce AIM xml files for a template image, and top matching dual regression and network images.
SECTION 3 - OVERVIEW OF ICA+ PIPELINE
INPUT: raw anatomical and resting bold data
- melodic_ss: Run ica on individual subjects –> list of icas run
- melodic_qa: List of icas –> Check QA –> passing subjects
- melodic_gp: Passing subjects –> group ICA –> group networks
- melodic_hp: All group networks –> highpass filter –> good networks and potential matching DR results.
- melodic_dr: All group networks –> dual regression –> significant differences
- pyMatch: Significant differences from good networks –> match to template –> top results and top stats and details on command line AIMTemp: Top results and template –> AIM xml Templates (see links below!)
OUTPUT: AIM xml files for:
- Structural image of interest (template image matched to)
- Top three overlapping “good” functional networks for ADHD ; control, 1 https://github.com/vsoch/vbmis.com/blob/master/projects/aim/AIM-gm_wm_input_p05_thresh_zstat3.xmlhttps://github.com/vsoch/vbmis.com/blob/master/projects/aim/AIM-gm_wm_input_p05_thresh_zstat21.xml match score determined by
- Dual regression results, significant differences for ADHD > Control https://github.com/vsoch/vbmis.com/blob/master/projects/aim/AIM-gm_wm_input_p05_dr7ic8.xmlhttps://github.com/vsoch/vbmis.com/blob/master/projects/aim/AIM-gm_wm_input_p05_dr2ic3.xml https://github.com/vsoch/vbmis.com/blob/master/projects/aim/AIM-gm_wm_input_p05_dr20ic21.xml for same networks.
SECTION 4 - CREATION AND TESTING OF MELODIC_HP
It was clear that K’s doTemplateMatch algorithm needed to be run only with “good” networks as input, meaning that there needed to be a step that filtered out networks with high frequency. K shared with me ICA_high_freq_filter (INSERT LINK) and I used MRtools in python to create the same functionality in melodic_hp.py. This python script is automatically submit by melodic_gp, after the group ica has been run, which means that anytime group networks are derived, a list of the “good” ones will also be produced. This list of “good” networks and (potential) dual regression results is output to the “list” folder in the experiment directory, for use as input for the “match” component of ica+. While the lists are just of “good” networks and their matching dual regression results, the user can see [[http://www.vbmis.com/bmi/project/aim/melodic_hp_out.txt|details of the run from the command line]], for example running this:
>> python melodic_hp.py -o /../Desktop/NYU10_bp/filter --name=gica --ts=/../Desktop/NYU10_bp/gica/NYU10.gica/groupmelodic.ica/report --gica=/../Desktop/NYU10_bp/gica/NYU10.gica/groupmelodic.ica/stats
produced the linked output, the summary text files of the good images in the “filter” folder in the experiment directory, and we can visually look at the reported good and bad components:
Bad components include: 10, 11, 17, 20 Good components include: [‘1’, ‘12’, ‘13’, ‘14’, ‘15’, ‘16’, ‘18’, ‘19’, ‘2’, ‘21’, ‘22’, ‘23’, ‘24’, ‘25’, ‘26’, ‘27’, ‘28’, ‘29’, ‘3’, ‘30’, ‘4’, ‘5’, ‘6’, ‘7’, ‘8’, ‘9’]
SECTION 5 - CREATION AND TESTING OF pyMatch
Now that we have filtered out the bad components from a series of group network images, we can test pyMatch.py to generate matching scores for an entire list of input images. pyMatch is also run on command line. I used the output file containing the “good” images as input to match to the gm_wm_p05.nii image result, and https://github.com/vsoch/vbmis.com/blob/master/projects/aim/pyMatch_out.txtgot the following output.
According to the script, the top three matches for the gray matter image to our dual regression results are:
dr_stage3_ic0007_tfce_corrp_tstat1.nii.gz dr_stage3_ic0002_tfce_corrp_tstat1.nii.gz dr_stage3_ic0020_tfce_corrp_tstat1.nii.gz
If you look at all of the scores with each match, it’s clear that overall, the gray matter image doesn’t match any of them very well, as the “difference scores” are very low! I will be interested to run this with the NYUALL dataset, and using both the negative and positive activations (something we need to talk about, as it is not implemented).
SECTION 6 - TEST OF AIMTemp.py with top matched results
I now would want to create AIM xml template for the top three matches, including the dual regression results, the template, and the original IC network images. The ica+ package script is set up to read in the output from pyMatch (the file with the template name and top matches) and additionally find the corresponding network images, but since I am doing this without it, I will have to create these manually by doing the following for each image:
>> python AIMTemp.py -o /../Desktop/NYU10_bp/aim --input=/../Desktop/NYU10_bp/dr/NYU10/result/dr_stage3_ic0007_tfce_corrp_tstat1.nii.gz --name=gm_wm_input_p05_dr7ic8
Directory already exists.
Checking URL...
Reading RDF...
Creating AIM Template...
Reading in data /../Desktop/NYU10_bp/dr/NYU10/result/dr_stage3_ic0007_tfce_corrp_tstat1.nii.gz...
Reading in data MR/aal2mni152.nii.gz...
Atlas image has unique values: [1, 2, 3, 4, 5, 6, 7, 8, 9, 10, 11, 12, 13, 14, 15, 16, 17, 18, 19, 20, 21, 22, 23, 24, 25, 26, 27, 28, 29, 30, 31, 32, 33, 34, 35, 36, 37, 38, 39, 40, 41, 42, 43, 44, 45, 46, 47, 48, 49, 50, 51, 52, 53, 54, 55, 56, 57, 58, 59, 60, 61, 62, 63, 64, 65, 66, 67, 68, 69, 70, 71, 72, 73, 74, 75, 76, 77, 78, 79, 80, 81, 82, 83, 84, 85, 86, 87, 88, 89, 90, 91, 92, 93, 94, 95, 96, 97, 98, 99, 100, 101, 102, 103, 104, 105, 106, 107, 108, 109, 110, 111, 112, 113, 114, 115, 116]

Labeling voxels in fmri image...
Found 6698 coordinates in image input with activation.
Configuring AIM Instance...
AIM Instance configuration complete.

AALIDs with activation, in atlas, found in AAL dictionary:
['63', '61', '11', '1', '65', '57', '99', '3', '73', '75', '71', '19', '97', '23', '33', '77', '24', '78', '20', '34', '32', '36', '68', '45', '48', '46', '72', '70', '4', '76', '58', '60', '74', '38', '8', '2', '56', '42', '30', '14', '16', '62', '12', '18', '66', '84', '64', '82', '86']

AALIDs with activation, in atlas image, but not in the dictionary, NOT added to AIM:
['7', '43', '44']
SEPTEMBER 7
IN A NUTSHELL
XNAT is finally working, and the next step is get imaging data –> xml in a pipeline up for the grant. I am in pause because I don’t have a good understanding of where a script like AIMTemplate.py might live, when it gets called, and if the XML produced would be most like a “header” file to describe imaging data, or an instance of a user query to populate a browser. I think it would be helpful to get a bullet-list of concrete goals to accomplish for the grant, and my understanding will better as I work on these! More details, and my thinking about the larger project, are detailed below.
XNAT
We now have a working installation, and the AIMTemplate.py matching script is also in progress. I think that I need a better understanding of how we want to utilize this system with our data for the grant, because a few things do not match up in my mind. ;To the best of my understanding, for the grant we want to show annotated imaging results as evidenc that having them, period, is useful. ;Is the goal then to annotate our dual regression results and put the files are the XNAT server? ;Here are my questions!
- We can only upload dicom files, and our results, and even “raw” data, is in nifti. I think that converting from dicom to nifti might be possible, but it seems backwards. Is this something I should pursue?
- It isn’t clear to me how the generation of the XML files (from AIMTemplate.py) relates to XNAT. Do we upload these into XNAT? Are the XML files just general, to be used somewhere else? To the best of my understanding, the XML file is an instance of a user query. I’m not sure what we do with this! The rest of the customization that I do on AIMTemplate.py is dependent on understanding the utilization of these files. If the XML file is meant to represent a result in completion, then we need to produce it to include all voxels with activation. If it is meant to represent a specific user query, then we need to produce it to take in user specified aal values, and only include those in the result.
- Is our goal to use XNAT in the short term to just share data, or are we thinking of XNAT as a starting spot for building something bigger?
BIG PICTURE THINKING=====
We want a system that allows for upload, organization, and query of different types of imaging results. It should be flexible enough to allow for all/new datatypes, and comparison across different types and groups.
SMALL GOAL: Level 1 The small goal is to be able to better inform a user query about a specific region or regions applied to ONE imaging result, and return results generated from the informed query and imaging result. An example is providing one dual regression result (a nifti image), asking about the amygdala (linked to an aalID), and getting an xml report that contains the activations, labels, and relationships for every voxel relevant to the amygdala. In this case scenario we are simply providing ONE imaging result, a region of interest, and this might be presented in a table for viewing.
SMALL GOAL: Level 2: To take this a step further, we might provide ONE imaging result, a region of interest, and ask a more complicated question that would require calculations on the values obtained. We might want to identify unique regions that are connected to our original amygdala, and return a mean activation for each of those regions. A step further would be a graphical representation of the query and result.
LARGE GOAL: The larger goal is to be able to take a user query and apply it to MANY imaging results, and to be able to make interesting comparisons between large, possibly unrelated datasets based on overlapping meta data. I think that trying to reproduce spm or fsl within a web browser isn’t what we should be trying to do, at least to start. Whether we are producing values from raw data or from a representation of a result, at the end of the day we want to represent results within a browser to allow for informed query and meta analysis. It makes sense to start with results at the group level, and in this case, our dual regression results are a good working example. What does a group result look like? We are talking about an image file, likely a nifti, that might contain Z values, probabilities, or mean values.
PEOPLE WANT TO KNOW: how does MY result, or this network / area I’m interested in, overlap with what other people have found? OR what things is my result connected to that I might be interested in? The input might be a voxel coordinate, a custom ROI/result image, or a network. We can simplify all of these inputs into a list of voxel coordinates.
RESULTS DATA OBJECT I propose that results are simplified into data objects. The actual data can be stored on a server, but not for live query, because that takes a long time. There might be a data import process that writes an xml file (or some other data structure) to match each result file. This file would have aalid, x, y, z, fmri value, label, and the other meta data of interest.
Case 1: User provides coordinates, niaim gives detailed relationships Step 1 is to put these coordinates in the same space (MNI), and hold on to voxel values, if applicable Step 2 is to label each voxel with an AALID using an atlas Step 3 is to filter these AALIDs through an ontology, and grab onto labels, and relationships Step 4 is to write these results to XML, and present to a user in a web form to filter and view Step 5: some sort of archiving of query? (which is an xml file)
Case 2: User Provides coordinates, niaim finds similar results Steps 1-3: equivalent to above. Step 4 is to write these results to XML, this XML is a representation of an informed query –; contains voxel values if user provided actual data Step 5 is to filter results based on user input (for example, gender, disease, etc). Step 6 is to query the group results data objects for overlapping aalids, the relationship of interest might be “is” or “part of.” Step 7 is to save information about group results objects that were found to be similar, perhaps calculate measure of similiarity, and present results to user
**Case 3: User Provides coordinates, niaim finds connections / networks ** Steps 1-3: equivalent to above Step 4: look for relationships that indicate being part of the same network (connected to) OR in the case of an image to be identified as a network, match input image to identified network results.
In a nutshell, the user puts in some image input, asks for similarity or connections, and the ontology serves to better inform the question (ie, it can tell us subregions, connections, etc), and returns a more complete query
```USER RELATIONSHIP STANDARD SPACE AAL / FMA LABELS XML QUERY INPUT QUERY Anatomical region and LOOKUP
- Anatomical Region overlap? (similar results, is/part of) network –; defined by x,y,z in MNI –; AALID,region_name,relationship write file
- Network connected to? (connects to/from) (already in MNI)
- Custom ROI
- Voxel coordinate
Custom ROI or voxel coord needs conversion to MNI DATA List of vox coords Expanded list(s) vox coords Lists in MNI space
``` The XML document produced is an instance that describes some data. It is a text representation of an imaging result. It makes sense that someone who has a specific question would generate a custom query –; custom XML file specific to what he/she is asking, and if these custom XML files are structured equivalently to XML files that describe a group results image, they could be compared. Group or individual data might be uploaded, and subjected to a filter that sucks out voxel coordinates and values. A result could have:
- Z values to represent strength of difference
- probability values to represent liklihood of belonging to a particular network for a particular group
- mean activations