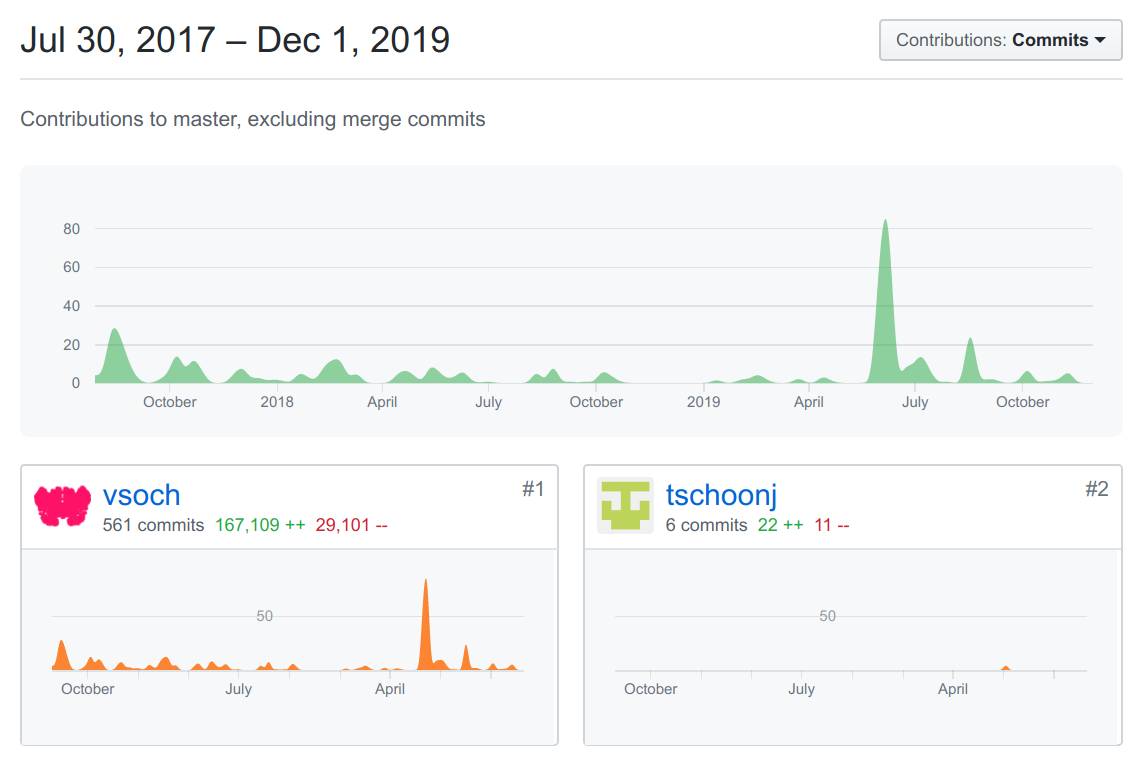
How do we measure and share contributions? If you’re familiar with GitHub, you’ve probably seen the contributors graphic. For example, for Singularity Registry Server, it looks like this:

What’s the problem here? It only focuses on commits, additions or deletions, or otherwise changes to the code. The reality is that there are many ways for individuals to contribute to a community. This graph is completely missing the number of people that have posted issues, asked questions, requested features, helped to test, and worked on the documentation. Especially for Singularity Registry Server, where development is completely driven by user needs, this graphic is totally disappointing.
Sourcecred
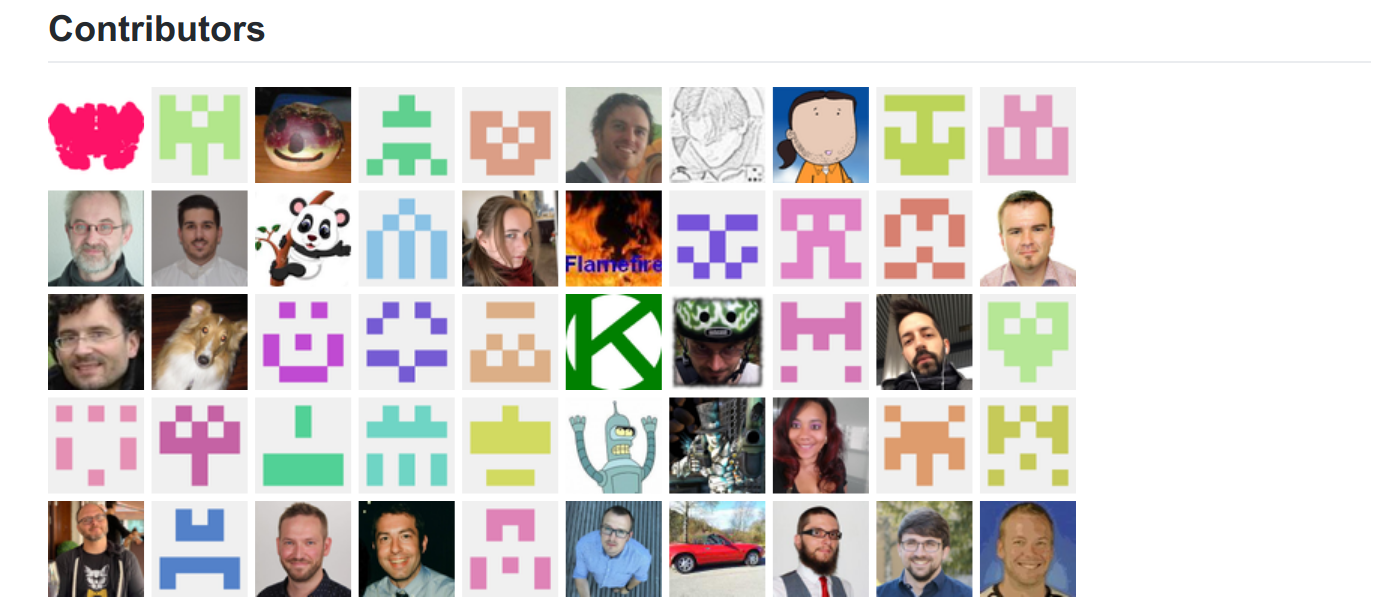
I stumbled on Sourcecred earlier in the year through common people in the Sustainable Free and Open Source Communities, also known as sfosc. It was a beautiful idea - a tool that would capture all kinds of contributions to a community, and (for advanced usage) even let you customize how you weighted those contributions. The core tool produces a more detailed contributors graph, but what I got really excited about was a widget extension to convert that to a grid of contributors. I probably wasn’t going to run server to host sourcecred anytime soon, but I definitely could generate and statically display a vector graphic. With this goal, I helped over a few months to set up continuous integration and container builds, and create an unnoficial GitHub workflow example for how to easily generate a graphic for a repository readme, sourcecred-action. Here’s the final, and what I believe to be more proper representation of all the folks that have been involved with Singularity Registry Server:

And see it live here. A lot of our smaller projects may never be grand like some of the larger ones on GitHub hosted by companies, but we should be proud of our small communities nonetheless.
How does it work?
1. Add the workflow
Briefly, you add one of two workflows to your repository.
- .github/workflows/pull_request.yml shows an example workflow to run a scheduled job to generate the graphic, and open a pull request for you to review.
- .github/workflows/automated.yml is the same process, but pushes directly to some branch.
You would of course choose the frequency and method that is most appropriate for your repository. For example, for Singularity Registry Server I chose the pull request approach, and I only want it to run once a month for my own maintainer sanity.
2. Link the Graphic!
And of course you can link to the graphic in the README! @Beanow showed me this trick to link to an svg:

3. Running the Action
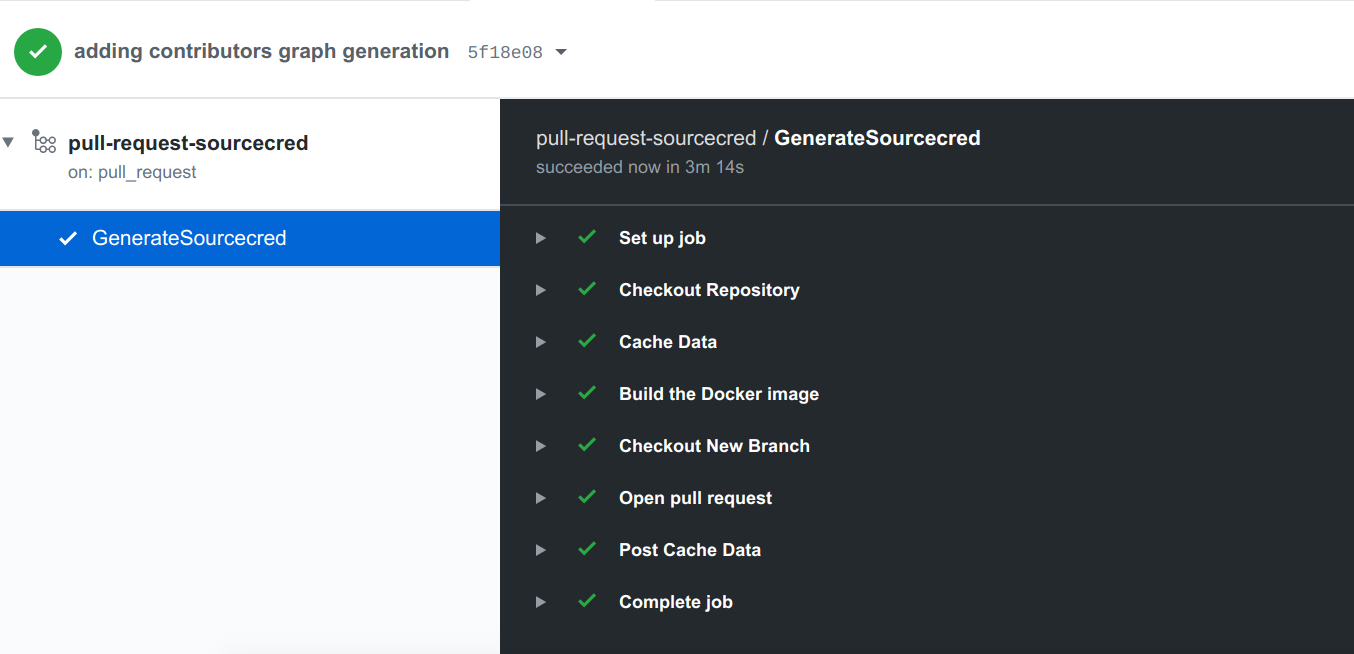
When the schedule triggers, your GitHub action will run! In the picture below, we see the expected steps of setting up the job and checking out the repository. The next step caches a folder (sourcecred_data) to help folks out with larger repositories (the GitHub API is used to summarize contributions across contribuors).

In the build step (we could better name this step) we then use the sourcecred/sourcecred:dev and sourcecred/widgets containers to generate the sourcecred data (the first container), and then the graphic (the widgets container). We checkout a new branch (stamped by the prefix “update/sourcecred-“ and ending with the date and push to the repository, and then open a pull request with it. The updated data is then cached, and the job complete.
3. Reviewing the Pull Request
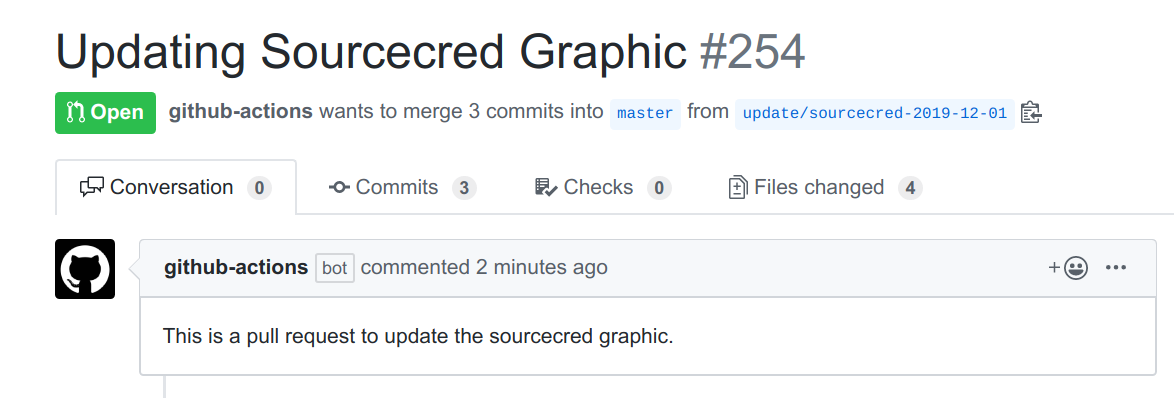
As the maintainer, you get a nice email that the pull request is open!

And then can review the pull request.

Actually, the pull request will only have one changed file - the one above was generated when I was adding the action, which had two new files for the workflow, an update to the README to link the graphic, and the graphic itself. So in practice this should show just one changed file. And of course if you wanted to commit directly to some GitHub pages (or other) branch, you could do that too, and skip step 4 entirely.
Why is this important?
There is an over-emphasis sometimes on contributions in the way of code. There isn’t enough attention given to people who are generally nice, and serve to welcome new members, answer questions, and even post little emoticons on posts to make the other person feel valued. There isn’t enough emphasis on folks who are spending a lot of time posting issues, or resolving them. By way of using a tool like sourcecred, we can value them too. And possibly someday, open source contributions can be better acknowledged, financially or otherwise. But that is a conversation for another day. Even if you don’t use sourcecred, I hope that you take some time to evaluate how your community is showing appreciation for its contributors, even if it’s just a graphic to show smiling faces on your repository.
Suggested Citation:
Sochat, Vanessa. "Showcase your Contributors!." @vsoch (blog), 01 Dec 2019, https://vsoch.github.io/2019/sourcecred/ (accessed 03 Jan 26).