I love any opportunity to create a project in Go, so when I saw the bloodorangeio/oci-stats tool, I was inspired! This project uses bash scripts and a Makefile to generate basic health stats for a repository, or basically a record of health files like a Contributing markdown or particular continuous integration recipe. If you have a lot of repos you want to quickly check for common community files presence or absence, it can be a useful tool. I liked the idea and wanted to do something similar, but provide a library in Go that is generalizable to different repository metrics, and that could easily be piped into an interactive interface. Note that this isn’t a hugely innovative idea, because many people have made these kinds of tools before. This is just a bit of dinosaur fun!
If you don’t care about the process, skip it and just ⭐️ check out the interface ⭐️. It’s fairly simple with Bootstrap, Jquery Datatables, and a custom font, and I imagine could be styled much better.
Codestats
Thus, vsoch/codestats was born! I always have little pet projects to work on in evenings and weekends, and this became my interest for the last week or so. For codestats, I wanted to accomplish the following:
- Provide a repository or organization to parse.
- Pair that with a set of metrics, where each metric is some action you can run on the root of a repository
- Extract either single repos or an entire org set to a json structure that renders into an interface.
Given that the library provides a pre-determined set of metrics, the user should have the choice to filter down to a custom set, or (if there is need to add a new metric) to open an issue and let me know! Right now the tests are written into the code, but I could totally see adding an ability to specify a custom test in the optional config yaml for the library.
How does it work?
Well, first you want to clone and build the library. You’ll need Go on your path!
$ git clone https://github.com/vsoch/codestats
$ cd codestats
$ make
This will place an executable, codestats that you can interact with. Then, here are examples
for how to run extractions. When we add –outfile that will save to the json file you specify, otherwise
we print to the console.
# Extract stats for the repository buildsi/build-abi-containers
$ ./codestats repo buildsi/build-abi-containers

# Do the same, but save to a file
$ ./codestats repo buildsi/build-abi-containers --outfile examples/repo.json


# Do the same, but pretty print to the screen (and run with go directly)
$ go run main.go repo buildsi/build-abi-containers --pretty

# Extract stats for an organization on GitHub
$ ./codestats org buildsi

build-notes
build-si-modeling
Smeagle
build-abi-tests
build-abi-containers
build-sandbox
...

# Only include those that match a pattern
$ ./codestats org buildsi --pattern build-abi-containers --pretty


# or again, save to output file:

$ ./codestats org buildsi --outfile examples/org.json
What if you want a custom set? You can generate a yaml file with the identifiers that you want:
# List of stats to include
stats:
- has-codeowners
- has-maintainers
- has-github-actions
- has-circle
- has-travis
- has-pull-approve
- has-glide
- has-code-of-conduct
- has-contributing
- has-authors
- has-pull-request-template
- has-issue-template
- has-support
- has-funding
- has-security```
I originally had camel case above to match Go, but realized this was way too hard to remember which to capitalize and opted for the above. Once we have this file, we hand it over to the command!
$ ./codestats repo buildsi/build-abi-containers --config examples/all-stats.yaml

# I also created one for GitHub "health files"
$ ./codestats repo buildsi/build-abi-containers --config examples/health-stats.yaml
The result of these commands is always a json file, and in a consistent format to include a list of repositories. Now the next step would be to make this data easy to search!
Web Interface
I decided to generate a set for the spack organization, but not including spack-search because it’s a monster in size. And I tested on the vsoch set, which are a set of files that I think important for open source projects (although not necessarily spack!). To do this I added a “vsoch-stats.yaml” file to the repository examples:
$ ./codestats org spack --skip spack-search --outfile examples/spack.json --config examples/vsoch-stats.yaml
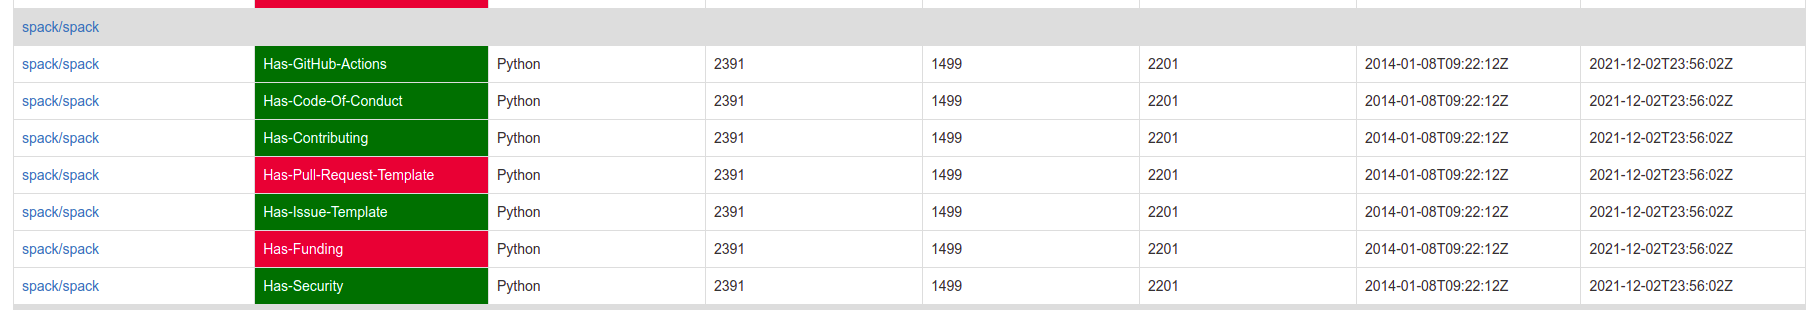
And this is how I generated this data that renders into the example interface. As a reminder - a red entry doesn’t always indicate bad - for some of these files, they may just not be appropriate for the organization type. For example, spack (shown at the top) could never have a funding.yaml file. But this is one of my vsoch metrics because I think it’s good to support open source maintainers.
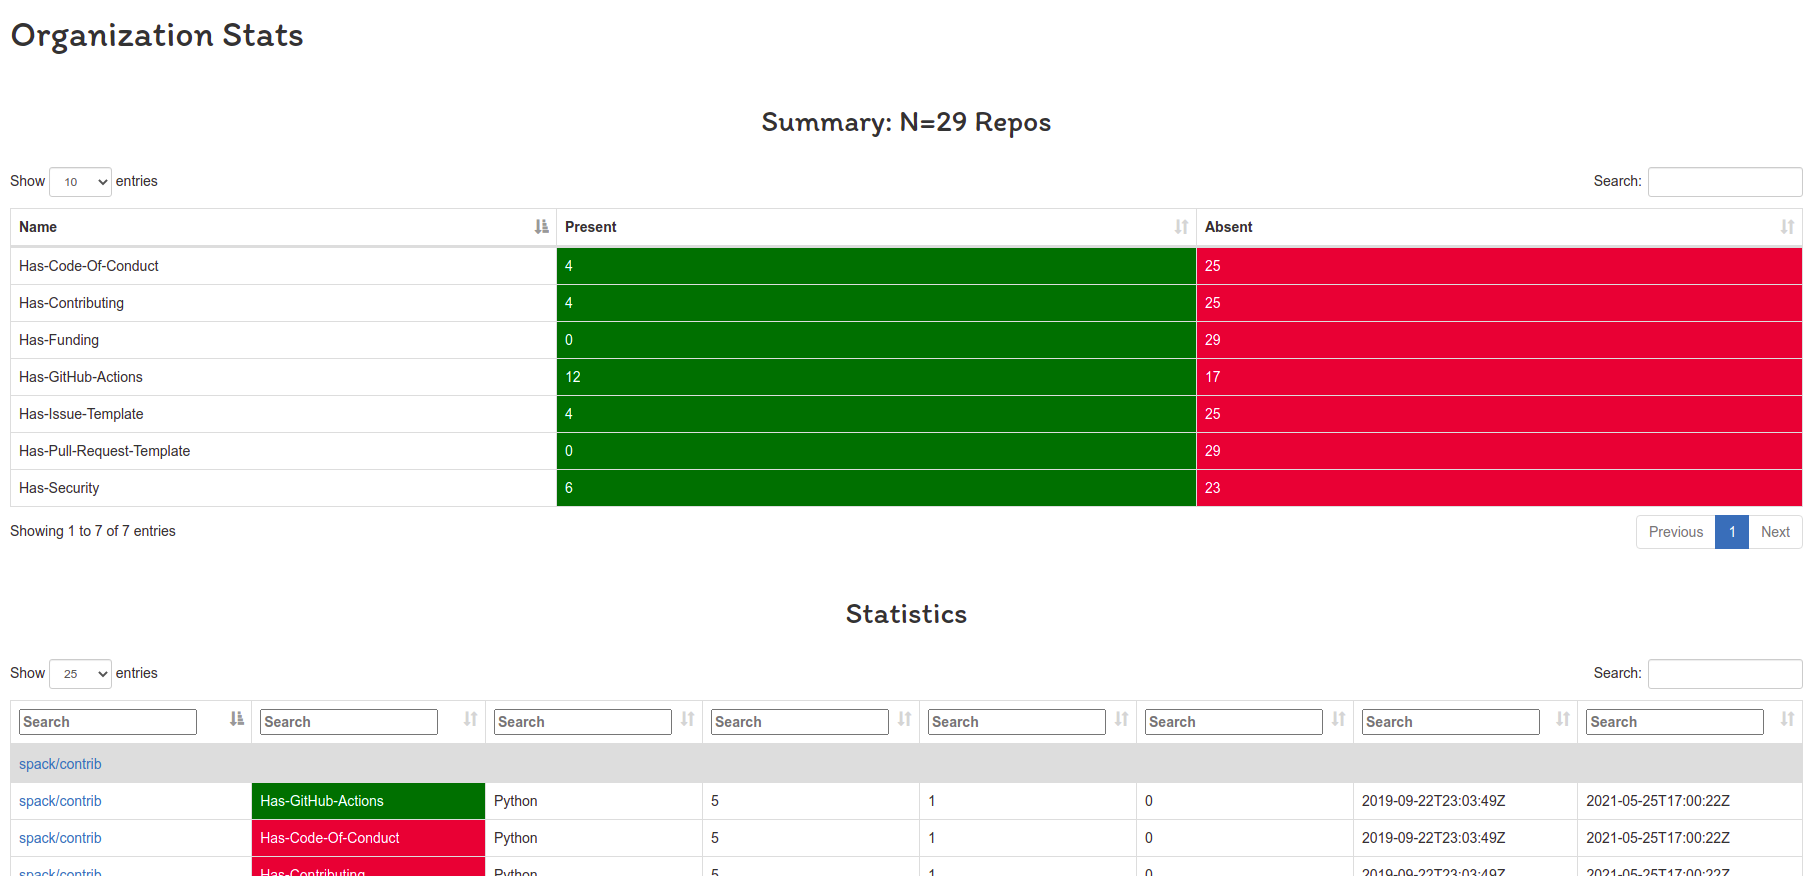
Pretty neat, huh? It uses Jquery Datatables to provide a searchable table, and you can also sort by columns or search within a column. Since one repository can span multiple rows, I also added header rows (for only the case when the table is sorted by the repository name), and a summary table at the very top.
Questions?
So what else would you like to see? Additional stats or interface support? Please open an issue and let me know! And thanks for stopping by!
Suggested Citation:
Sochat, Vanessa. "Codestats." @vsoch (blog), 02 Dec 2021, https://vsoch.github.io/2021/codestats/ (accessed 20 Jun 26).