We don’t care enough about resource usage. If there could be unique patterns associated with running different software, wouldn’t it be lucrative to study them, and then classify an unknown process? Or to predict resource usage given the programs involved? It’s a hard problem, but it’s cool enough that I want to talk about it, and show you some fun I had today thinking about it.
I’ve been working on a tool to monitor resource usage called watchme, and on Friday I released a version with not only a Python decorator and task, but also a terminal monitor that will allow you to run watchme on the fly for any process that you launch. You can still specify an interval t o record at, and filter the metrics however you please. If you’ve used GNU time, it’s similar in usage to that. For example, here I am going to monitor the sleep command, and take a recording every second:
$ watchme monitor sleep 10 --seconds 1
If you are interested, here is an asciinema video of that in action. But let’s skip over the dummy examples and jump into something a little more fun - using watchme to:
- Monitor Container Pulls on the Sherlock cluster using Singularity
- Measure Memory Usage for a containerized sklearn model.
- Why Should I Care? and then talk about why in the world you should care at all.
Feel free to jump around if one is more interesting to you.
Monitoring Container Pulls
I wanted to collect resource usage during a Singularity pull of several containers including ubuntu, busybox, centos, alpine, and nginx. I chose these fairly randomly. The goal was to create plots, taking a measurement each second, and asking a very basic question:
Is there varying performance based on the amount of memory available?
This meant that I launched a job, and manipulated only the amount of memory. Here is my quick submission loop (the sbatch command submits the job in the file pull-job.sh):
for iter in 1 2 3 4 5; do
    for name in ubuntu busybox centos alpine nginx; do
        for mem in 4 6 8 12 16 18 24 32 64 128; do
            output="${outdir}/${name}-iter${iter}-${mem}gb.json"
            echo "sbatch --mem=${mem}GB pull-job.sh ${mem} ${iter} ${name} ${output}"
            sbatch --mem=${mem}GB pull-job.sh "${mem}" "${iter}" "${name}" ${output}
        done
    done
done
and then “pull-job.sh” collected the input arguments, and pulled the container on the node:
mem=${1}
iter=${2}
name=${3}
output=${4}

# Add variables for host, cpu, etc.
export WATCHMEENV_HOSTNAME=$(hostname)
export WATCHMEENV_NPROC=$(nproc)
export WATCHMEENV_MAXMEMORY=${mem}
watchme monitor singularity pull --force docker://$name --name $name-$iter --seconds 1 > ${output}
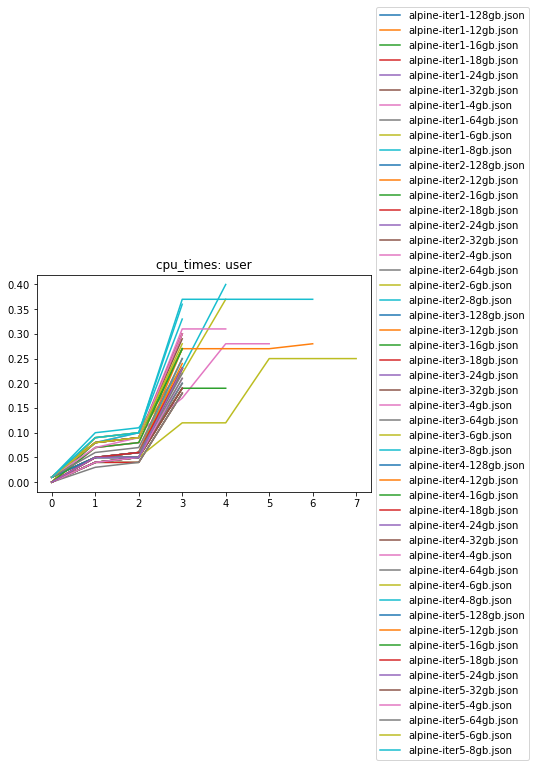
Notice how the “singularity pull” command is wrapped with “watchme monitor” - this is how I’m handing off the process for watchme to run and watch. For this approach, I installed watchme, and opted to pipe results directly into files named according to the parameters. The full set of output files are here. Most of these pulls are between 4 and 10 seconds, so there isn’t a ton of data recorded, but I’ll quickly show an example of what I found. First, let’s look at cpu time in user space during the pull of alpine. What is cpu time in user space, as opposed to system / kernel space? It’s the amount of time [1][2] that the processor spends pulling our container. A higher value for this metric means that the process is taking more time. I would expect that asking for less memory for a job corresponds with getting less user CPU time. And this (might be?) what we see - here is a pull for alpine.

Yeah, I was a bit lazy to just show all the iterations on the same plot. It’s a bit all over the place, and hard to make any sort of conclusion. But what I do find interesting is the kink in the plot at around 2 seconds. I would guess that Singularity starts running, and at around 2 seconds starts to do something (slightly) more CPU intensive, like extraction of layers and then building the SIF binary. Sure, the units of change are very small, but we can watch a pull to see how behavior (represented by the terminal logging) corresponds with what we’ve measured:
Did you see that? The first two seconds when we were “Starting Build” likely correspond with the first rise in the graph. Then when we pull and extract layers, albeit the change being small, we demand (and get) more user CPU time. You can also see higher user CPU times for a beefier image like ubuntu.
Measure Memory Usage
Let’s step it up a notch, and try measuring the training of a model. I’ve put it in a container. I want to run it in parallel on my cluster, but I have no idea how much memory to ask for!
$ sbatch --partition owners --mem=??? job.sh
1. Prepare your Analysis
Can watchme help? Yes, I think so! I will sheepishly admit that I had maybe a couple of job submission scripts in graduate school, and I rarely changed the amount of memory that I asked for. I always set it at some high value that I was sure wouldn’t poop out. But actually, I’d have been able to run more jobs and to use the cluster resources more optimally if I had just spent a little time to accurately estimate memory for my jobs. Let’s do this now. I started with this sklearn mnist example, and built it into a container:
FROM continuumio/miniconda3

# docker build -t vanessa/watchme-mnist .
# docker push vanessa/watchme-mnist

RUN apt-get update && apt-get install -y git
RUN conda install scikit-learn matplotlib
ADD run.py /run.py
ENTRYPOINT ["python", "/run.py"]
and served it at vanessa/watchme-mnist.
2. Testing Environment
First, I’m going to grab an interactive node on my cluster. I could use sdev, but I want to ask for a bit more time and memory than comes by default.
$ srun --mem=32GB --time=24:00:00 --pty bash
and pull the container.
$ singularity pull docker://vanessa/watchme-mnist
I first tried running watchme on the container to collect metrics:
$ watchme monitor --seconds 1 singularity run watchme-mnist_latest.sif plots.png > mnist-external.json
I strangely found in the data export
that after the first call to singularity, we weren’t able to derive much from the process that we execv’d to
named starter-suid. This means that we need to install the monitor inside the container:
FROM continuumio/miniconda3

# docker build -t vanessa/watchme-mnist .
# docker push vanessa/watchme-mnist

RUN apt-get update && apt-get install -y git
RUN conda install scikit-learn matplotlib memory_profiler
RUN pip install watchme
ADD run.py /run.py
ENTRYPOINT ["python", "/run.py"]
Re-pull our container
$ singularity pull docker://vanessa/watchme
and try again! This is a learning experience for both of us. I didn’t anticipate that I wouldn’t be able to measure inside the container. In retrospect, it makes sense. Here is our updated command - notice that singularity is run first, and the process we exec is for watchme to monitor our script.
$ singularity exec watchme-mnist_latest.sif watchme monitor --seconds 1 python /run.py plots.png > mnist.json
In the above, I monitored the command to run the container, singularity run watchme-mnist_latest.sif,
from inside of the container. I asked watchme to record all metrics every 1 second, and I piped the json
result into a file.
Thank goodness that Singularity has seamless connection to the host (binds, environment), because
I could easily do this. I could then make a few simple plots to look at memory.

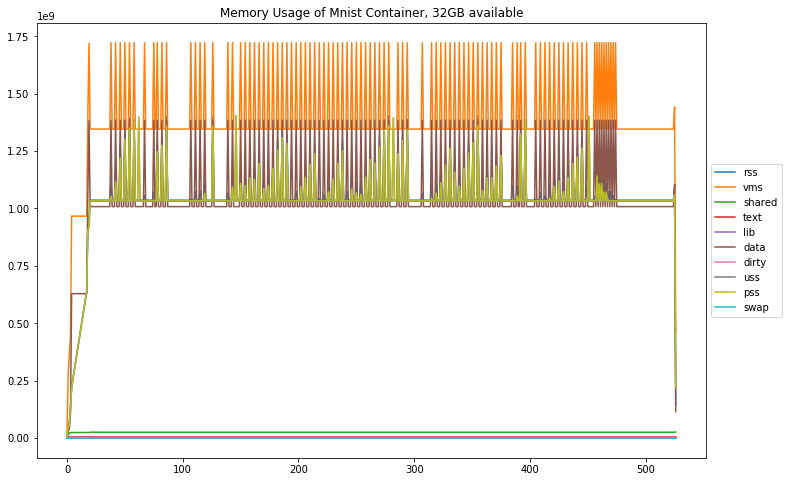
Oh this is so neat! Well, what do we see off the bat?
How much memory is the process using?
Out of the memory metrics that psutils can measure, only a few of them are non-zero. According to the docs and here, unique set size is probably the best representative of the process memory usage.
Unique set size (uss). In computing, unique set size (USS) is the portion of main memory (RAM) occupied by a process which is guaranteed to be private to that process.
How much memory is available, total?
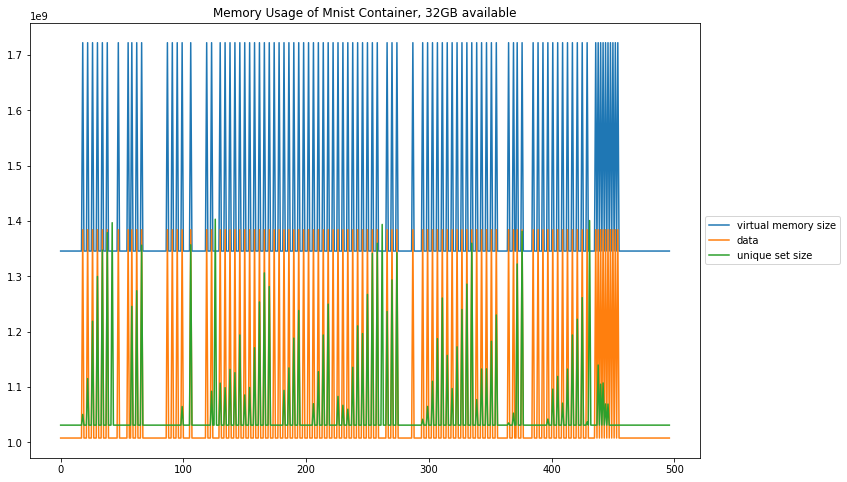
I was confused to see only 1.7GB for virtual memory size, because I thought I had asked for more. First, I decided to look at the maximum value of the virtual memory size, “1722089472” (this is in bytes). Let’s zoom in on the chart above.

As we can see, the maximum is around 1.7, which is 1.7GB. But… didn’t I ask for more? Let’s look more closely at the node we were on. I didn’t specify the number of processing units that I got, so I got…
[vsochat@sh-108-42 ~/.watchme/mnist]$ nproc
1
Just 1! And then to confirm what we see in the plot, we can look at /proc/meminfo:
[vsochat@sh-108-42 ~/.watchme/mnist]$ cat /proc/meminfo
MemTotal:       196438172 kB
MemFree:        164311444 kB
MemAvailable:   169037160 kB
Buffers:             492 kB
Cached:          4682540 kB
SwapCached:         2660 kB
Active:          3281700 kB
Inactive:        3413948 kB
Active(anon):    2183656 kB
Inactive(anon):   204200 kB
Active(file):    1098044 kB
Inactive(file):  3209748 kB
Unevictable:       89784 kB
Mlocked:           89796 kB
SwapTotal:       4194300 kB
SwapFree:        4170720 kB
Dirty:                20 kB
Writeback:             0 kB
AnonPages:       2099752 kB
Mapped:            38748 kB
Shmem:            362580 kB
Slab:           22616180 kB
SReclaimable:    1168932 kB
SUnreclaim:     21447248 kB
KernelStack:       17760 kB
PageTables:        10796 kB
NFS_Unstable:          0 kB
Bounce:                0 kB
WritebackTmp:          0 kB
CommitLimit:    102413384 kB
Committed_AS:    2898952 kB
VmallocTotal:   34359738367 kB
VmallocUsed:     1669384 kB
VmallocChunk:   34257489200 kB
HardwareCorrupted:     0 kB
AnonHugePages:         0 kB
CmaTotal:              0 kB
CmaFree:               0 kB
HugePages_Total:       0
HugePages_Free:        0
HugePages_Rsvd:        0
HugePages_Surp:        0
Hugepagesize:       2048 kB
DirectMap4k:      624448 kB
DirectMap2M:    26251264 kB
DirectMap1G:    175112192 kB
See at the top, how “MemFree” and “MemTotal” is between 164311444 and 196438172 kB? It would sort of make sense to get a maximum virtual memory somewhere between those two, as we did. So for the node that I ran the container on, although I asked for 32GB, I got about half of that. Strange.
What did I learn?
SLURM Seems Messy
A lot of times when you think you are asking for a specific resource allocation, if you aren’t specific about everything from memory to number of processes, you are likely to not get exactly what you think. In my case, the memory argument was totally useless because I got half of what I asked for. Further, it sort of seems like the nodes vary widely in their actual configurations, and when I think about it, this makes sense too. They are added slowly over time, with varying models and configurations depending on the labs that funded them. I would even bet that the memory argument isn’t enforced beyond SLURM possibly watching the process, and just killing it if it goes over. I wonder what this means for shared jobs on a node? The whole setup just seems messy, especially if you are used to bringing up a cloud instance, and generally knowing that you have the entire thing. I remember that SLURM (used to?) have an exclusive flag, now it makes sense why someone would use it. After this exercise, I strangely have more sympathy for graduate school version of me that didn’t spend too much time optimizing job submissions. It seems to be messy anyway, might as well ask for more than you need and pray.
Containers Isolate some Metrics
As we mentioned earlier, containers isolate some metrics from the host. I should have remembered this would be the case, but I didn’t! To make using watchme easier for you, I’ve provided Docker bases that come ready to go with watchme so you can easily monitor processes inside of containers, also from inside of the container.
Tracking Actual Memory is Useful
Regardless of what SLURM gives me, tracking actual resources is an interesting practice. What I learned today is that If I want to track memory usage for a process, I should look at “memory_full_info” -> “uss” and compare to what (the container sees) as the total available, “memory_full_info” -> “vms.” If you want some (rough) code to do this, see my notebook here. One thing I’m thinking of now is that it would be useful to have some ready-to-go scripts to parse the output. If you are interested in this, please open an issue.
Why should I care?
Asking for Resources
I was originally going to say that you should care because it would allow you to more efficiently ask for resources, but I no longer find that a compelling answer.
Machine Learning to Categorize Software
If you are someone that is interested in data science or machine learning, there is a trove of work to be done in this area. Take a look at these plots. Or better yet, take a look at the metrics that I didn’t get to touch on, including io operations, cpu, connections, and many more I have yet to read about. In the same way that we saw a logical pattern in the Singularity pull data, I would hypothesize that we could associate patterns with different software or programs, and then be able to see an unknown entity running, and detect if any of the patterns that we know are present. For example, let’s say that a script starts with pulling a Singularity container. Might it be possible to detect the pattern? It’s akin to how YouTube analyzes copyright music from your video audio track. It’s a really cool idea, and I think with software put in place to collect metrics, and then a large collection of data, this would be an awesomet thing to do.
Suggested Citation:
Sochat, Vanessa. "Watchme Terminal Monitor." @vsoch (blog), 19 May 2019, https://vsoch.github.io/2019/watchme-monitor/ (accessed 02 Apr 26).