vsoch
vanessa villamia sochat
-
Visualizations, Contain yourselves!
Visualizing things is really challenging. The reason is because it’s relatively easy to make a visualization that is too complex for what it’s trying to show, and it’s much harder to make a visualization catered for a specific analysis problem. Simplicity is usually the best strategy, but while standard plots (e.g., scatter, box and whisker, histogram) are probably ideal for publications, they aren’t particularly fun to think about. You also have the limitations of your medium and where you paint the picture. For example, a standard web browser will get slow when you try to render ~3000 points with D3. In these cases you are either trying to render too many, or you need a different strategy (e.g., render points on canvas in favor of number over interactivity).
I recently embarked on a challenge to visualize a model defined at every voxel in the brain (a voxel is a little 3D cube of brain landscape associated with an X,Y,Z coordinate). Why would I want to do this? I won’t go into details here, but with such models you could predict what a statistical brain map might look like based on cognitive concepts, or predict a set of cognitive concepts from a brain map. This work is still being prepared for publication, but we needed a visualization because the diabolical Poldrack is giving a talk soon, and it would be nice to have some way to show output of the models we had been working on. TLDR: I made a few Flask applications and shoved them into Docker continers with all necessary data, and this post will review my thinking and design process. The visualizations are in no way “done” (whatever that means) because there are details and fixes remaining.
Step 1: How to cut the data
We have over 28K models, each built from a set of ~100 statistical brain maps (yes, tiny data) with 132 cognitive concepts from the Cognitive Atlas. When you think of the internet, it’s not such big data, but it’s still enough to make putting it in a single figure challenging. Master Poldrack had sent me a paper from the Gallant Lab, and directed me to Figure 2:

I had remembered this work from the HIVE at Stanford, and what I took away from it was the idea for the strategy. If we wanted to look at the entire model for a concept, that’s easy, look at the brain maps. If we want to understand all of those brain maps at one voxel, then the visualization needs to be voxel-specific. This is what I decided to do.
Step 2: Web framework
Python is awesome, and the trend for neuroimaging analysis tools is moving toward Python dominance. Thus, I decided to use a small web framework called Flask that makes data –> server –> web almost seamless. It takes a template approach, meaning that you write views for a python-based server to render, and they render using jinja2 templates. You can literally make a website in under 5 minutes.
Step 3: Data preparation
This turned out to be easy. I could generate either tab delimited or python pickled (think a compressed data object) files, and store them with the visualizations in their respective Github repos.
Regions from the AAL Atlas
At first, I generated views to render a specific voxel location, some number from 1..28K that corresponded with an X,Y,Z coordinate. The usability of this is terrible. Is someone really going to remember that voxel N corresponds to “somewhere in the right Amygdala?” Probably not. What I needed was a region lookup table. I wasn’t decided yet about how it would work, but I knew I needed to make it. First, let’s import some bread and butter functions!
import pandas
import nibabel
import requests
import xmltodict
from nilearn.image import resample_img
from nilearn.plotting import find_xyz_cut_coords
The
requestslibrary is important for getting anything from a URL into a python program.nilearnis a nice machine learning library for python (that I usually don’t use for machine learning at all, but rather the helper functions), andxmltodictwill do exactly that, convert an xml file into a superior data format :). First, we are going to use the Neurovault RESTApi to both obtain a nice brain map, and the labels from it. In the script to run this particular python script, we have already downloaded the brain map itself, and now we are going to load it, resample to a 4mm voxel (to match the data in our model), and then associate a label with each voxel:# OBTAIN AAL2 ATLAS FROM NEUROVAULT data = nibabel.load("AAL2_2.nii.gz") img4mm = nibabel.load("MNI152_T1_4mm_brain_mask.nii.gz") # Use nilearn to resample - nearest neighbor interpolation to maintain atlas aal4mm = resample_img(data,interpolation="nearest",target_affine=img4mm.get_affine()) # Get labels labels = numpy.unique(aal4mm.get_data()).tolist() # We don't want to keep 0 as a label labels.sort() labels.pop(0) # OBTAIN LABEL DESCRIPTIONS WITH NEUROVAULT API url = "http://neurovault.org/api/atlases/14255/?format=json" response = requests.get(url).json()We now have a json object with a nice path to the labels xml! Let’s get that file, convert it to a dictionary, and then parse away, Merrill.
# This is an xml file with label descriptions
xml = requests.get(response["label_description_file"])
doc = xmltodict.parse(xml.text)["atlas"]["data"]["label"]  # convert to a superior data structure :)
Pandas is a module that makes nice data frames. You can think of it like a numpy matrix, but with nice row and column labels, and functions to sort and find things.
# We will store region voxel value, name, and a center coordinate
regions = pandas.DataFrame(columns=["value","name","x","y","z"])

# Count is the row index, fill in data frame with region names and indices
count = 0
for region in doc:
    regions.loc[count,"value"] = int(region["index"])
    regions.loc[count,"name"] = region["name"]
    count+=1
I didn’t actually use this in the visualization, but I thought it might be useful to store a “representative” coordinate for each region:
# USE NILEARN TO FIND REGION COORDINATES (the center of the largest activation connected component)
for region in regions.iterrows():
    label = region[1]["value"]
    roi = numpy.zeros(aal4mm.shape)
    roi[aal4mm.get_data()==label] = 1
    nii = nibabel.Nifti1Image(roi,affine=aal4mm.get_affine())
    x,y,z = [int(x) for x in find_xyz_cut_coords(nii)]
    regions.loc[region[0],["x","y","z"]] = [x,y,z]
and then save the data to file, both the “representative” coords, and the entire aal atlas as a squashed vector, so we can easily associate the 28K voxel locations with regions.
# Save data to file for application regions.to_csv("../data/aal_4mm_region_coords.tsv",sep="\t") # We will also flatten the brain-masked imaging data into a vector, # so we can select a region x,y,z based on the name region_lookup = pandas.DataFrame(columns=["aal"]) region_lookup["aal"] = aal4mm.get_data()[img4mm.get_data()!=0] region_lookup.to_pickle("../data/aal_4mm_region_lookup.pkl")For this first visualization, that was all that was needed in the way of data prep. The rest of the files I already had on hand, nicely formatted, from the analysis code itself.
Step 4: First Attempt: Clustering
My first idea was to do a sort of “double clustering.” I scribbled the following into an email late one night:
…there are two things we want to show. 1) is relationships between concepts, specifically for that voxel. 2) is the relationship between different contrasts, and then how those contrasts are represented by the concepts. The first data that we have that is meaningful for the viewer are the tagged contrasts. For each contrast, we have two things: an actual voxel value from the map, and a similarity metric to all other contrasts (spatial and/or semantic). A simple visualization would produce some clustering to show to the viewer how the concepts are similar / different based on distance. The next data that we have “within” a voxel is information about concepts at that voxel (and this is where the model is integrated). Specifically - a vector of regression parameters for that single voxel. These regression parameter values are produced via the actual voxel values at the map (so we probably would not use both). What I think we want to do is have two clusterings - first cluster the concepts, and then within each concept bubble, show a smaller clustering of the images, clustered via similarity, and colored based on the actual value in the image (probably some shade of red or blue).
Yeah, please don’t read that. The summary is that I would show clusters of concepts, and within each concept cluster would be a cluster of images. Distance on the page, from left to right, would represent the contribution of the concept cluster to the model at the voxel. This turned out pretty cool:
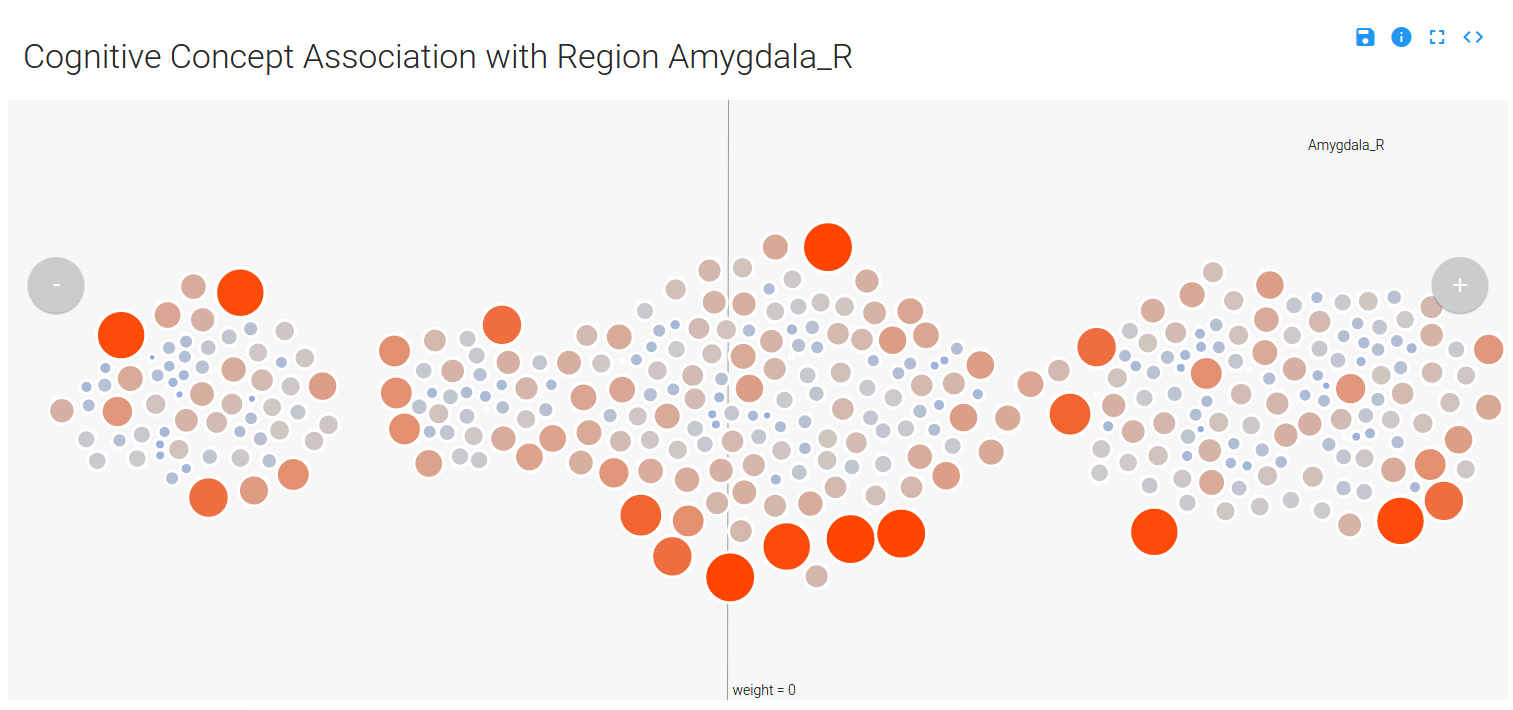
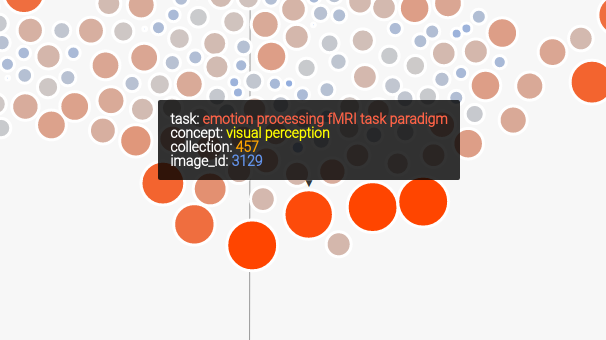
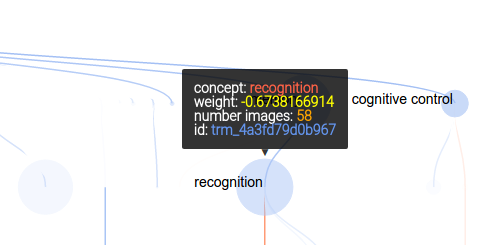
You can mouse over a node, which is a contrast image (a brain map) associated with a particular cognitive concept, and see details (done by way of tipsy). Only concepts that have a weight (weight –> importance in the model) that is not zero are displayed (and this reduces the complexity of the visualization quite a bit), and the nodes are colored and sized based on their value in the original brain map (red/big –> positive, and blue/small –> negative):
You can use the controls in the top right to expand the image, save as SVG, link to the code, or read about the application:

You can also select a region of choice from the dropdown menu, which uses select2 to complete your choice. At first I showed the user the voxel location I selected as “representative” for the region, but I soon realized that there were quite a few large regions in the AAL atlas, and that it would be incorrect and misleading to select a representative voxel. To embrace the variance within a region but still provide meaningful labels, I implemented it so that a user can select a region, and a random voxel from the region is selected:
    ...
    # Look up the value of the region
    value = app.regions.value[app.regions.name==name].tolist()[0]

    # Select a voxel coordinate at random
    voxel_idx = numpy.random.choice(app.region_lookup.index[app.region_lookup.aal == value],1)[0]

    return voxel(voxel_idx,name=name)
Typically, Flask view functions return… views :). In this case, the view returned is the original one that I wrote (the function is called
voxel) to render a view based on a voxel id (from 1..28K). The user just sees a dropdown to select a region:
Finally, since there are multiple images tagged with the same concept in an image, you can mouse over a concept label to highlight those nodes in the image. You can also mouse over a concept label to highlight all the concepts associated with the image. We also obtain a sliced view of the image from NeuroVault to show to the user.
Step 5: Problems with First Attempt
I first thought it was a pretty OK job, until my extremely high-standard brain started to tell me how crappy it was. The first problem is that the same image is shown for every concept it’s relevant for, and that’s both redundant and confusing. It also makes no sense at all to be showing an entire brain map when the view is defined for just one voxel. What was I thinking?
The second problem is that the visualization isn’t intuitive. It’s a bunch of circles floating in space, and you have to read the “about” very careful to say “I think I sort of get it.” I tried to use meaningful things for color, size, and opacity, but it doesn’t give you really a sense of anything other than, maybe, magnetic balls floating in gray space.
I thought about this again. What a person really wants to know, quickly, are
1) which cognitive concepts are associated with the voxel?
2) How much?
3) How do the concepts relate in the ontology?I knew very quickly that the biggest missing component was some representation of the ontology. How was “recognition” related to “memory” ? Who knows! Let’s go back to the drawing table, but first, we need to prepare some new data.
Step 6: Generating a Cognitive Atlas Tree
A while back I added some functions to pybraincompare to generate d3 trees from ontologies, or anything you could represent with triples. Let’s do that with the concepts in our visualization to make a simple json structure that has nodes with children.
from pybraincompare.ontology.tree import named_ontology_tree_from_tsv
from cognitiveatlas.datastructure import concept_node_triples
import pickle
import pandas
import re
First we will read in our images, and we only need to do this to get the image contrast labels (a contrast is a particular combination / subtraction of conditions in a task, like “looking at pictures of cats minus baseline”).
# Read in images metadata
images = pandas.read_csv("../data/contrast_defined_images_filtered.tsv",sep="\t",index_col="image_id")
The first thing we are going to do is generate a “triples data structure,” a simple format I came up with that would be simple for pybraincompare to understand that would allow it to render any kind of graph into the tree. It looks like this:
## STEP 1: GENERATE TRIPLES DATA STRUCTURE

'''
  id    parent  name
  1 none BASE                   # there is always a base node
  2 1   MEMORY                  # high level concept groups
  3 1   PERCEPTION
  4 2   WORKING MEMORY          # concepts
  5 2   LONG TERM MEMORY
  6 4   image1.nii.gz           # associated images (discovered by way of contrasts)
  7 4   image2.nii.gz
'''
Each node has an id, a parent, and a name. For the next step, I found the unique contrasts represented in the data (we have more than one image for contrasts), and then made a lookup to find sets of images based on the contrast.
# We need a dictionary to look up image lists by contrast ids
unique_contrasts = images.cognitive_contrast_cogatlas_id.unique().tolist()

# Images that do not match the correct identifier will not be used (eg, "Other")
expression = re.compile("cnt_*")
unique_contrasts = [u for u in unique_contrasts if expression.match(u)]

image_lookup = dict()
for u in unique_contrasts:
   image_lookup[u] = images.index[images.cognitive_contrast_cogatlas_id==u].tolist()
To make the table I showed above, I had added a function to the Cognitive Atlas API python wrapper called concept_node_triples.
output_triples_file = "../data/concepts.tsv"

# Create a data structure of tasks and contrasts for our analysis
relationship_table = concept_node_triples(image_dict=image_lookup,output_file=output_triples_file)
The function includes the contrast images themselves as nodes, so let’s remove them from the data frame before we generate and save the JSON object that will render into a tree:
# We don't want to keep the images on the tree keep_nodes = [x for x in relationship_table.id.tolist() if not re.search("node_",x)] relationship_table = relationship_table[relationship_table.id.isin(keep_nodes)] tree = named_ontology_tree_from_tsv(relationship_table,output_json=None) pickle.dump(tree,open("../data/concepts.pkl","w")) json.dump(tree,open("../static/concepts.json",'w'))Boum! Ok, now back to the visualization!
Step 7: Second Attempt: Tree
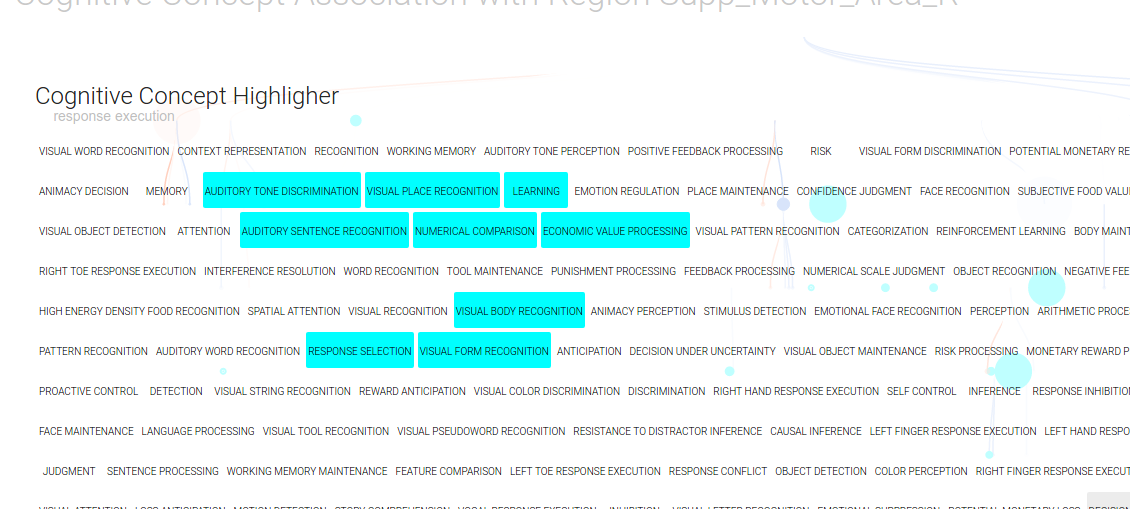
For this attempt, I wanted to render a concept tree in the browser, with each node in the tree corresponding to a cognitive concept, and colored by the “importance” (weight) in the model. As before, red would indicate positive weight, and blue negative (this is a standard in brain imaging, by the way). To highlight the concepts that are relevant for the particular voxel model, I decided to make the weaker nodes more transparent, and nodes with no contribution (weight = 0) completely invisible. However, I would maintain the tree structure to give the viewer a sense of distance in the ontology (distance –> similarity). This tree would also solve the problem of understanding relationships between concepts. They are connected!
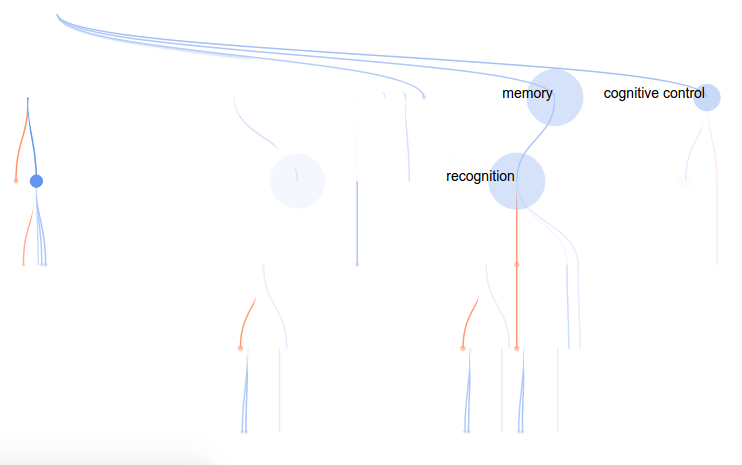
As before, mousing over a node provides more information:
and the controls are updated slightly to include a “find in page” button:

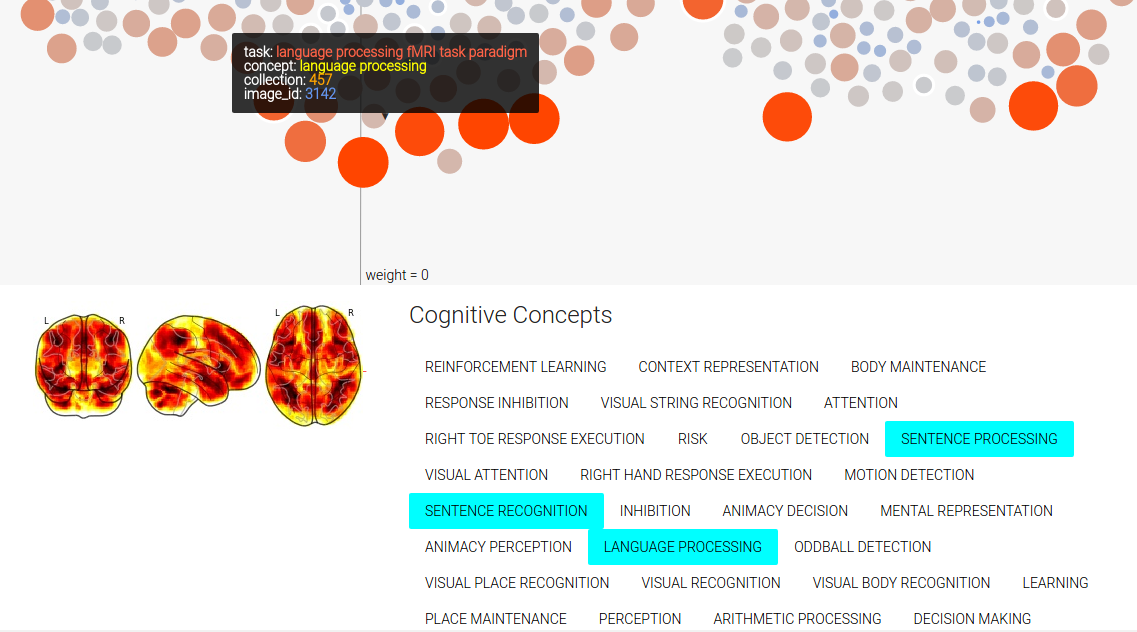
Which, when you click on it, brings up an overlay where you can select any cogntiive concepts of your choice with clicks, and they will light up on the tree!
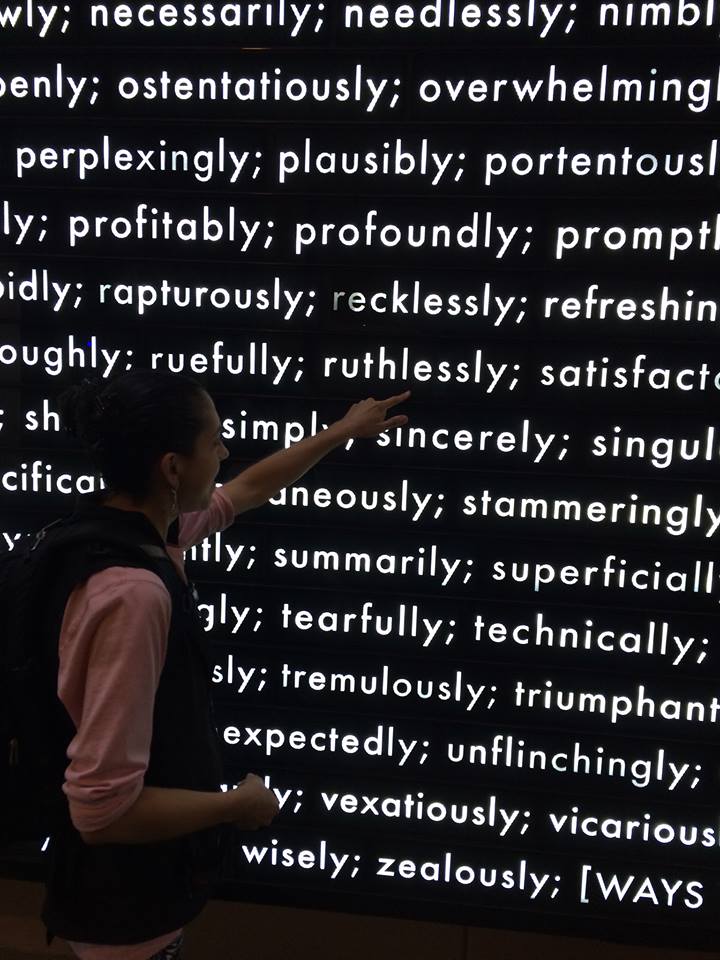
If you want to know the inspiration for this view, it’s a beautiful installation at the Stanford Business School that I’m very fond of:
The labels were troublesome, because if I rendered too many it was cluttered and unreadable, and if I rendered too few it wasn’t easy to see what you were looking at without mousing over things. I found a rough function that helped a bit, but my quick fix was to simply limit the labels shown based on the number of images (count) and the regression parameter weight:
// Add concept labels var labels = node.append("text") .attr("dx", function (d) { return d.children ? -2 : 2; }) .attr("dy", 0) .classed("concept-label",true) .style("font","14px sans-serif") .style("text-anchor", function (d) { return d.children ? "end" : "start"; }) .html(function(d) { // Only show label for larger nodes with regression parameter >= +/- 0.5 if ((counts[d.nid]>=15) && (Math.abs(regparams[d.nid])>=0.5)) { return d.name } });Step 8: Make it reproducible
You can clone the repo on your local machine and run the visualization with native Flask:
    git clone https://github.com/vsoch/cogatvoxel
    cd cogatvoxel
    python index.py
Notice anything missing? Yeah, how about installing dependencies, and what if the version of python you are running isn’t the one I developed it in? Eww. The easy answer is to Dockerize! It was relatively easy to do, I would use docker-compose to grab an nginx (web server) image, and my image vanessa/cogatvoxeltree built on Docker Hub. The Docker Hub image is built from the Dockerfile in the repo, which installs dependencies, maps the code to a folder in the container called
/codeand then exposes port 8000 for Flask:FROM python:2.7 ENV PYTHONUNBUFFERED 1 RUN apt-get update && apt-get install -y \ libopenblas-dev \ gfortran \ libhdf5-dev \ libgeos-dev MAINTAINER Vanessa Sochat RUN pip install --upgrade pip RUN pip install flask RUN pip install numpy RUN pip install gunicorn RUN pip install pandas ADD . /code WORKDIR /code EXPOSE 8000Then the docker-compose file uses this image, along with the nginx web server (this is pronounced “engine-x” and I’ll admit it took me probably 5 years to figure that out).
web:
  image: vanessa/cogatvoxeltree
  restart: always
  expose:
    - "8000"
  volumes:
    - /code/static
  command: /usr/local/bin/gunicorn -w 2 -b :8000 index:app

nginx:
  image: nginx
  restart: always
  ports:
    - "80:80"
  volumes:
    - /www/static
  volumes_from:
    - web
  links:
    - web:web
It’s probably redundant to again expose port 8000 in my application (the top one called “web”), and add
/www/staticto the web server static. To make things easy, I decided to use gunicorn to manage serving the application. There are many ways to skin a cat, there are ways to run a web server… I hope you choose web servers over skinning cats.That’s about it. It’s a set of simple Flask applications to render data into a visualization, and it’s containerized. To be honest, I think the first is a lot cooler, but the second is on its way to a better visualization for the problem at hand. There is still a list of things that need fixing and tweaking (for example, not giving the user control over the threshold for showing the node and links is not ok), but I’m much happier with this second go. On that note, I’ll send a cry for reproducibility out to all possible renderings of data in a browser…
·Visualizations, contain yourselves!
-
Wordfish: tool for standard corpus and terminology extraction
If pulling a thread of meaning from woven text
is that which your heart does wish.
Not so absurd or seemingly complex,
if you befriend a tiny word fish.
I developed a simple tool for standard extraction of terminology and corpus, Wordfish, that is easily deployed to a cluster environment. I’m graduating (hopefully, tentatively, who knows) soon, and because publication is unlikely, I will write about the tool here, in the case it is useful to anyone. I did this project for fun, mostly because I found DeepDive to be overly complicated for my personal goal of extracting a simple set of terms from a corpus in the case that I couldn’t define relationships apriori (I wanted to learn them from the data). Thus I used neural networks (word2vec) to learn term relationships based on their context. I was able to predict reddit boards for different mental illness terms with high accuracy, and it sort of ended there because I couldn’t come up with a good application in Cognitive Neuroscience, and no “real” paper is going to write about predicting reddit boards. I was sad to not publish something, but then I realized I am empowered to write things on the internet. :) Not only that, I can make up my own rules. I don’t have to write robust methods with words, I will just show and link you to code. I might even just use bulletpoints instead of paragraphs. For results, I’ll link to ipython notebooks. I’m going to skip over the long prose and trust that if you want to look something up, you know how to use Google and Wikipedia. I will discuss the tool generally, and show an example of how it works. First, an aside about publication in general - feel free to skip this if you aren’t interested in discussing the squeaky academic machine.
Why sharing incomplete methods can be better than publication
It’s annoying that there is not a good avenue, or even more so, that it’s not desired or acceptable, to share a simple (maybe even incomplete) method or tool that could be useful to others in a different context. Publication requires the meaningful application. It’s annoying that, as researchers, we salivate for these “publication” things when the harsh reality is that this slow, inefficient process results in yet another PDF/printed thing with words on a page, offering some rosy description of an analysis and result (for which typically minimal code or data is shared) that makes claims that are over-extravagant in order to be sexy enough for publication in the first place (I’ve done quite a bit of this myself). A publication is a static thing that, at best, gets cited as evidence by another paper (and likely the person making the citation did not read the paper to full justice). Maybe it gets parsed from pubmed in someone’s meta analysis to try and “uncover” underlying signal across many publications that could have been transparently revealed in some data structure in the first place. Is this workflow really empowering others to collaboratively develop better methods and tools? I think not. Given the lack of transparency, I’m coming to realize that it’s much faster to just share things early. I don’t have a meaningful biological application. I don’t make claims that this is better than anything else. This is not peer reviewed by some three random people that gives it a blessing like from a rabbi. I understand the reasons for these things, but the process of conducting research, namely hiding code and results toward that golden nugget publication PDF, seems so against a vision of open science. Under this context, I present Wordfish.
Wordfish: tool for standard corpus and terminology extraction


Abstract
The extraction of entities and relationships between them from text is becoming common practice. The availability of numerous application program interfaces (API) to extract text from social networks, blogging platforms and feeds, standard sources of knowledge is continually expanding, offering an extensive and sometimes overwhelming source of data for the research scientist. While large corporations might have exclusive access to data and robust pipelines for easily obtaining the data, the individual researcher is typically granted limited access, and commonly must devote substantial amounts of time to writing extraction pipelines. Unfortunately, these pipelines are usually not extendable beyond the dissemination of any result, and the process is inefficiently repeated. Here I present Wordfish, a tiny but powerful tool for the extraction of corpus and terms from publicly available sources. Wordfish brings standardization to the definition and extraction of terminology sources, providing an open source repository for developers to write plugins to extend their specific terminologies and corpus to the framework, and research scientists an easy way to select from these corpus and terminologies to perform extractions and drive custom analysis pipelines. To demonstrate the utility of this tool, I use Wordfish in a common research framework: classification. I first build deep learning models to predict Reddit boards from post content with high accuracy. I hope that a tool like Wordfish can be extended to include substantial plugins, and can allow easier access to ample sources of textual content for the researcher, and a standard workflow for developers to add a new terminology or corpus source.
Introduction
While there is much talk of “big data,” when you peek over your shoulder and look at your colleague’s dataset, there is a pretty good chance that it is small or medium sized. When I wanted to extract terms and relationships from text, I went to DeepDive, the ultimate powerhouse to do this. However, I found that setting up a simple pipeline required database and programming expertise. I have this expertise, but it was tenuous. I thought that it should be easy to do some kind of NLP analysis, and combine across different corpus sources. When I started to think about it, we tend to reuse the same terminologies (eg, an ontology) and corpus (pubmed, reddit, wikipedia, etc), so why not implement an extraction once, and then provide that code for others? This general idea would make a strong distinction between a developer, meaning an individual best suited to write the extraction pipeline, and the researcher, an individual best suited to use it for analysis. This sets up the goals of Wordfish: to extract terms from a corpus, and then do some higher level analysis, and make it standardized and easy.
Wordfish includes data structures that can capture an input corpus or terminology, and provides methods for retrieval and extraction. Then, it allows researchers to create applications that interactively select from the available corpus and terminologies, deploy the applications in a cluster environment, and run an analysis. This basic workflow is possible and executable without needing to set up an entire infrastructure and re-writing the same extraction scripts that have been written a million times before.
Methods
The overall idea behind the infrastructure of wordfish is to provide terminologies, corpus, and an application for working with them in a modular fashion. This means that Wordfish includes two things, wordfish-plugins and wordfish-python. Wordfish plugins are modular folders, each of which provides a standard data structure to define extraction of a corpus, terminology or both. Wordfish python is a simple python module for generating an application, and then deploying the application on a server to run analyses.
Wordfish Plugins
A wordfish plugin is simply a folder with typically two things: a functions.py file to define functions for extraction, and a config.json that is read by wordfish-python to deploy the application. We can look at the structure of a typical plugin:
  plugin
        functions.py
        __init__.py
        config.json
Specifically, the functions.py has the following functions:
1) extract_terms: function to call to return a data structure of terms
2) extract_text: function to call to return a data structure of text (corpus)
3) extract_relations: function to call to return a data structure of relations
4) functions.py: is the file in the plugin folder to store these functionsThe requirement of every
functions.pyis an import of general functions fromwordfish-pythonthat will save a data structure for a corpus, terminology, or relationships:# IMPORTS FOR ALL PLUGINS from wordfish.corpus import save_sentences from wordfish.terms import save_terms from wordfish.terms import save_relations from wordfish.plugin import generate_jobThe second requirement is a function,
go_fish, which is the main function to be called bywordfish-pythonunder the hood. In this function, the user writing the plugin can make as many calls togenerate_jobas necessary. A call to generate job means that a slurm job file will be written to run a particular function (func) with a specified category or extraction type (e.g.,terms,corpus, orrelations). This second argument helps the application determine how to save the data. Ago_fishfunction might look like this:# REQUIRED WORDFISH FUNCTION def go_fish(): generate_job(func="extract_terms",category="terms") generate_job(func="extract_relations",category="relations")The above will generate slurm job files to be run to extract terms and relations. Given input arguments are required for the function, the specification can look as follows:
generate_job(func="extract_relations",inputs={"terms":terms,"maps_dir":maps_dir},category="relations",batch_num=100)where
inputsis a dictionary of keys being variable names, values being the variable value. The addition of thebatch_numvariable also tells the application to split the extraction into a certain number of batches, corresponding to SLURM jobs. This is needed in the case that running a node on a cluster is limited to some amount of time, and the user wants to further parallelize the extraction.Extract terms
Now we can look at more detail at the
extract_termsfunction. For example, here is this function for the cognitive atlas. Theextract_termswill return a json structure of termsdef extract_terms(output_dir): terms = get_terms() save_terms(terms,output_dir=output_dir)You will notice that the
extract_termsfunction uses another function that is defined infunctions.py,get_terms. The user is free to include in thewordfish-pluginfolder any number of additional files or functions that assist toward the extraction. Here is whatget_termslooks like:def get_terms(): terms = dict() concepts = get_concepts() for c in range(len(concepts)): concept_id = concepts[c]["id"] meta = {"name":concepts[c]["name"], "definition":concepts[c]["definition_text"]} terms[concept_id] = meta return termsThis example is again from the Cognitive Atlas, and we are parsing cognitive ceoncepts into a dictionary of terms. For each cognitive concept, we are preparing a dictionary (JSON data structure) with fields
name, anddefinition.We then put that into another dictionarytermswith the key as the unique id. This unique id is important in that it will be used to link between term and relations definitions. You can assume that the other functions (e.g.,get_conceptsare defined in thefunctions.pyfile.Extract relations
For
extract_relationswe return a tuple of the format(term1_id,term2_id,relationship):def extract_relations(output_dir): links = [] terms = get_terms() concepts = get_concepts() for concept in concepts: if "relationships" in concept: for relation in concept["relationships"]: relationship = "%s,%s" %(relation["direction"],relation["relationship"]) tup = (concept["id"],relation["id"],relationship) links.append(tup) save_relations(terms,output_dir=output_dir,relationships=links)Extract text
Finally,
extract_textreturns a data structure with some unique id and a blob of text. Wordfish will parse and clean up the text. The data structure for a single article is again, just JSON:corpus[unique_id] = {"text":text,"labels":labels}Fields include the actual text, and any associated labels that are important for classification later. The corpus (a dictionary of these data structures) gets passed to
save_sentencessave_sentences(corpus_input,output_dir=output_dir)More detail is provided in the wordfish-plugin README
The plugin controller: config.json
The plugin is understood by the application by way of a folder’s
config.json, which might look like the following:[ { "name": "NeuroSynth Database", "tag": "neurosynth", "corpus": "True", "terms": "True", "labels": "True", "relationships":"True", "dependencies": { "python": [ "neurosynth", "pandas" ], "plugins": ["pubmed"] }, "arguments": { "corpus":"email" }, "contributors": ["Vanessa Sochat"], "doi": "10.1038/nmeth.1635", } ]1) name: a human readable description of the plugin
2) tag: a term (no spaces or special characters) that corresponds with the folder name in the plugins directory. This is a unique id for the plugin.
3) corpus/terms/relationships: boolean, each “True” or “False” should indicate if the plugin can return a corpus (text to be parsed by wordfish) or terms (a vocabulary to be used to find mentions of things), or relations (relationships between terms). This is used to parse current plugins available for each purpose, to show to the user.
4) dependencies: should include “python” and “plugins.”Pythoncorresponds to python packages that are dependencies, and these plugins are installed by the overall application.Pluginsrefers to other plugins that are required, such as pubmed. This is an example of a plugin that does not offer to extract a specific corpus, terminology, or relations, but can be included in an application for other plugins to use. In the example above, the neurosynth plugin requires retrieving articles from pubmed, so the plugin develop specifies needing pubmed as a plugin dependency.
5) arguments: a dictionary with (optionally) corpus and/or terms. The user will be asked for these arguments to run theextract_textandextract_termsfunctions.
6) contributors: a name/orcid ID or email of researchers responsible for creation of the plugins. This is for future help and debugging.
7) doi: a reference or publication associated with the resource. Needed if it’s important for the creator of the plugin to ascribe credit to some published work.Best practices for writing plugins
Given that a developer is writing a plugin, it is generally good practice to print to the screen what is going on, and how long it might take, as a courtesy to the user, if something needs review or debugging.
“Extracting relationships, will take approximately 3 minutes”
The developer should also use clear variable names, well documented and spaced functions (one liners are great in python, but it’s more understandable by the reader if to write out a loop sometimes), and attribute function to code that is not his. Generally, the developer should just follow good practice as a coder and human being.
Functions provided by Wordfish
While most users and clusters have internet connectivity, it cannot be assumed, and an error in attempting to access an online resource could trigger an error. If a plugin has functions that require connectivity, Wordfish provides a function to check:
      from wordfish.utils import has_internet_connectivity
      if has_internet_connectivity():
          # Do analysis
If the developer needs a github repo, Wordfish has a function for that:
      from wordfish.vm import download_repo
      repo_directory = download_repo(repo_url="https://github.com/neurosynth/neurosynth-data")
If the developer needs a general temporary place to put things,
tempfileis recommended:import tempfile tmpdir = tempfile.mkdtemp()Wordfish has other useful functions for downloading data, or obtaining a url. For example:
      from wordfish.utils import get_url, get_json
      from wordfish.standards.xml.functions import get_xml_url
      myjson = get_json(url)
      webpage = get_url(url)
      xml = get_xml_url(url)
Custom Applications with Wordfish Python
The controller, wordfish-python is a flask application that provides the user (who is just wanting to generate an application) with an interactive web interface for doing so. It is summarized nicely in the README:
Choose your input corpus, terminologies, and deployment environment, and an application will be generated to use deep learning to extract features for text, and then entities can be mapped onto those features to discover relationships and classify new texty things. Custom plugins will allow for dynamic generation of corpus and terminologies from data structures and standards of choice from wordfish-plugins You can have experience with coding (and use the functions in the module as you wish), or no experience at all, and let the interactive web interface walk you through generation of your application.
Installation can be done via github or pip:
      pip install git+git://github.com/word-fish/wordfish-python.git
      pip install wordfish
And then the tool is called to open up a web interface to generate the application:
wordfish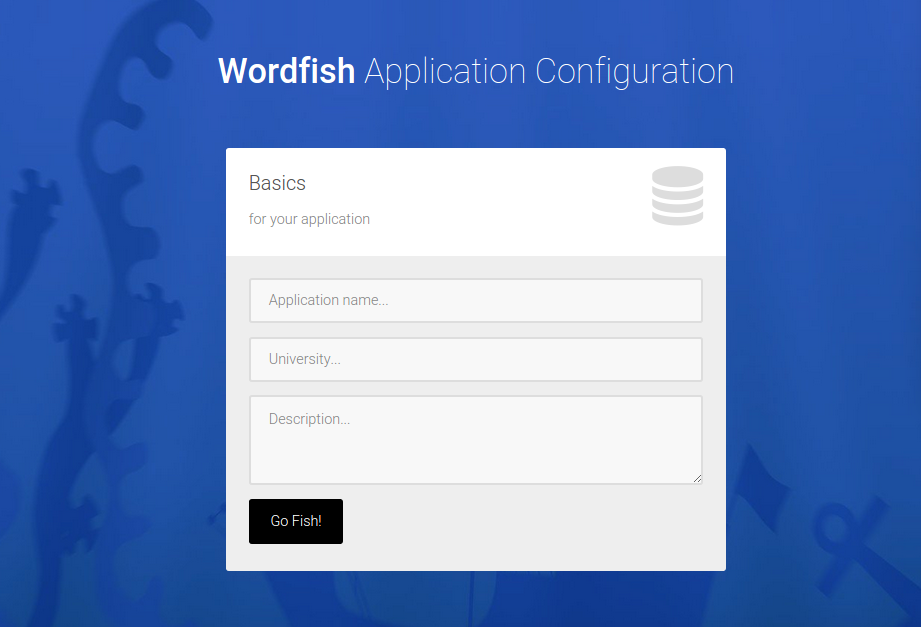
The user then selects terminologies and corpus.
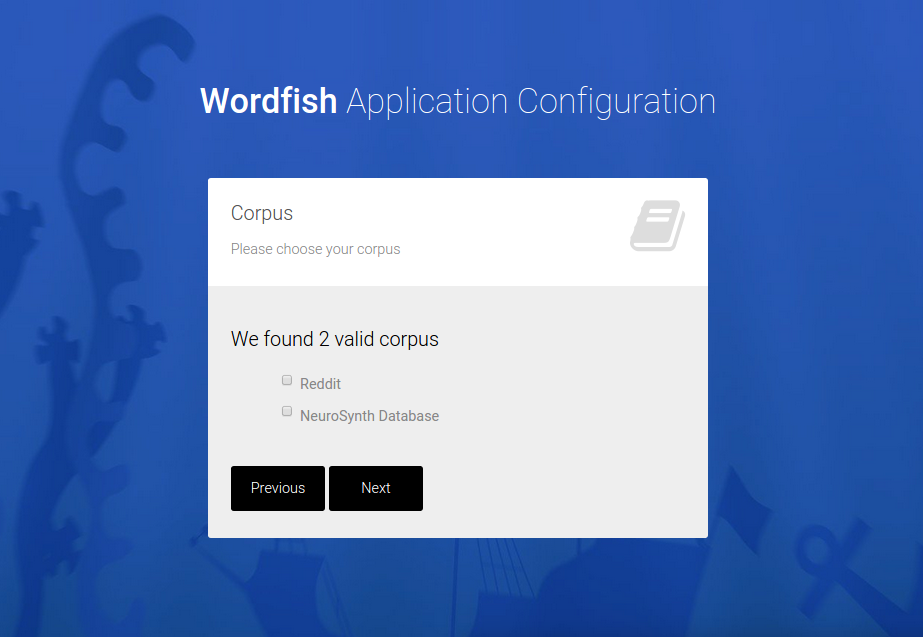

And a custom application is generated, downloaded as a zip file in the browser. A “custom application” means a folder that can be dropped into a cluster environment, and run to generate the analysis,

Installing in your cluster environment
The user can drop the folder into a home directory of the cluster environment, and run the install script to install the package itself, and generate the output folder structure. The only argument that is needed is to supply is the base of the output directory:
      WORK=/scratch/users/vsochat/wordfish
      bash install.sh $WORK
All scripts for the user to run are in the scripts folder here:
cd $WORK/scriptsEach of these files corresponds to a step in the pipeline, and is simply a list of commands to be run in parallel. The user can use launch, or submit each command to a SLURM cluster. A basic script is provided to help submit jobs to a SLURM cluster, and this could be tweaked to work with other clusters (e.g., SGE).
Running the Pipeline
After the installation of the custom application is complete, this install script simply runs
run.py, which generates all output folders and running scripts. the user has a few options for running:1) submit the commands in serial, locally. The user can run a job file with bash,
bash run_extraction_relationships.job
2) submit the commands to a launch cluster, something likelaunch -s run_extraction_relationships.job
3) submit the commands individually to a slurm cluster. This will mean reading in the file, and submitting each script with a line likesbatch -p normal -j myjob.job [command line here]Output structure
The jobs are going to generate output to fill in the following file structure in the project base folder, which again is defined as an environmental variable when the application is installed (files that will eventually be produced are shown):
      WORK
              corpus
                  corpus1
                      12345_sentences.txt
                      12346_sentences.txt
                  corpus2
                      12345_sentences.txt
                      12346_sentences.txt
              terms
                  terms1_terms.txt
                  terms2_relationships.txt

              scripts
                  run_extraction_corpus.job
                  run_extraction_relationships.job
                  run_extraction_terms.job
The folders are generated dynamically by the
run.pyscript for each corpus and terms plugin based on thetagvariable in the plugin’sconfig.json. Relationships, by way of being associated with terms, are stored in the equivalent folder, and the process is only separate because it is not the case that all plugins for terms can have relationships defined. The corpus are kept separate at this step as the output has not been parsed into any standard unique id space. Wordfish currently does not do this, but if more sophisticated applications are desired (for example with a relational database), this would be a good strategy to take.Analysis
Once the user has files for corpus and terms, he could arguably do whatever he pleases with them. However, I found the word2vec neural network to be incredibly easy and cool, and have provided a simple analysis pipeline to use it. This example will merge all terms and corpus into a common framework, and then show examples of how to do basic comparisons, and vector extraction (custom analyses scripts can be based off of this). We will do the following:
1) Merge terms and relationships into a common corpus
2) For all text extract features with deep learning (word2vec)
3) Build classifiers to predict labels from vectorsWord2Vec Algorithm
First, what is a word2vec model? Generally, Word2Vec is a neural network implementation that will allow us to learn word embeddings from text, specifically a matrix of words by some N features that best predict the neighboring words for each term. This is an interesting way to model a text corpus because it’s not about occurrence, but rather context, of words, and we can do something like compare a term “anxiety” in different contexts. If you want equations, see this paper.
The problem Wordfish solves
Wordfish currently implements Word2Vec. Word2Vec is an unsupervised model. Applications like DeepDive take the approach that a researcher knows what he or she is looking for, requiring definition of entities as first step before their extraction from a corpus. This is not ideal given that a researcher has no idea about these relationships, or lacks either positive or negative training examples. In terms of computational requirements, Deepdive also has some that are unrealistic. For example, using the Stanford Parser is required to determine parts of speech and perform named entity recognition. While this approach is suitable for a large scale operation to mine very specific relationships between well-defined entities in a corpus, for the single researcher that wants to do simpler natural language processing, and perhaps doesn’t know what kind of relationships or entities to look for, it is too much. This researcher may want to search for some terms of interest across a few social media sources, and build models to predict one type of text content from another. The researcher may want to extract relationships between terms without having a good sense of what they are to begin with, and definition of entities, relationships, and then writing scripts to extract both should not be a requirement. While it is reasonable to ask modern day data scientists to partake in small amounts of programming, substantial setting up of databases and writing extraction pipelines should not be a requirement. A different approach that is taken by Wordfish is to provide plugins for the user to interactively select corpus and terminology, deploy their custom application in their computational environment of choice, and perform extraction using the tools that are part of their normal workflows, which might be a local command line or computing cluster.
When the DeepDive approach makes sense, the reality is that setting up the infrastructure to deploy DeepDive is really hard. When we think about it, the two applications are solving entirely different problems. All we really want to do is discover how terms are related in text. We can probably do ok to give DeepDive a list of terms, but then to have to “know” something about the features we want to extract, and have positive and negative cases for training is really annoying. If it’s annoying for a very simple toy analysis (finding relationships between cognitive concepts) I can’t even imagine how that annoyingness will scale when there are multiple terminologies to consider, different relationships between the terms, and a complete lack of positive and negative examples to validate. This is why I created Wordfish, because I wanted an unsupervised approach that required minimal set up to get to the result. Let’s talk a little more about the history of Word2Vec from this paper.
The N-Gram Model
The N-gram model (I think) is a form of hidden Markov Model where we model the P(word) given the words that came before it. The authors note that N-gram models work very well for large data, but in the case of smaller datasets, more complex methods can make up for it. However, it follows logically that a more complex model on a large dataset gives us the best of all possible worlds. Thus, people started using neural networks for these models instead.
simple models trained on huge amounts of data outperform complex systems trained on less data.
The high level idea is that we are going to use neural networks to represent words as vectors, word “embeddings.” Training is done with stochastic gradient descent and backpropagation.
How do we assess the quality of word vectors?
Similar words tend to be close together, and given a high dimensional vector space, multiple representations/relationships can be learned between words (see top of page 4). We can also perform algebraic computations on vectors and discover cool relationships, for example, the vector for V(King) - V(Man) + V(Woman) is close to V(Queen). The most common metric to compare vectors seems to be cosine distance. The interesting thing about this approach reported here is that by combining individual word vectors we can easily represent phrases, and learn new interesting relationships.
Two different algorithm options
You can implement a continuous bag of words (CBOW) or skip-gram model: 1) CBOW: predicts the word given the context (other words)
2) skip-gram: predicts other words (context) given a word (this seems more useful for what we want to do)They are kind of like inverses of one another, and the best way to show this is with a picture:

Discarding Frequent Words
The paper notes that having frequent words in text is not useful, and that during training, frequent words are discarded with a particular probability based on the frequency. They use this probability in a sampling procedure when choosing words to train on so the more frequent words are less likely to be chosen. For more details, see here, and search Google.
Building Word2Vec Models
First, we will train a simple word2vec model with different corpus. And to do this we can import functions from Wordfish, which is installed by the application we generated above.
	from wordfish.analysis import build_models, save_models, export_models_tsv, load_models, extract_similarity_matrix, export_vectors, featurize_to_corpus
	from wordfish.models import build_svm
	from wordfish.corpus import get_corpus, get_meta, subset_corpus
	from wordfish.terms import get_terms
	from wordfish.utils import mkdir
	import os
Installation of the application also write the environmental variable
WORDFISH_HOMEto your bash profile, so we can reference it easily:base_dir = os.environ["WORDFISH_HOME"]It is generally good practice to keep all components of an analysis well organized in the output directory. It makes sense to store analyses, models, and vectors:
	# Setup analysis output directories
	analysis_dir = mkdir("%s/analysis" %(base_dir))
	model_dir = mkdir("%s/models" %(analysis_dir))
	vector_dir = mkdir("%s/vectors" %(analysis_dir))
Wordfish then has nice functions for generating a corpus, meaning removing stop words, excess punctuation, and the typical steps in NLP analyses. The function
get_corpusreturns a dictionary, with the key being the unique id of the corpus (the folder name,tagof the original plugin). We can then use thesubset_corpusplugin if we want to split the corpus into the different groups (defined by the labels we specified in the initial data structure):# Generate more specific corpus by way of file naming scheme corpus = get_corpus(base_dir) reddit = corpus["reddit"] disorders = subset_corpus(reddit) corpus.update(disorders)We can then train corpus-specific models, meaning word2vec models.
	# Train corpus specific models
	models = build_models(corpus)
Finally, we can export models to tsv, export vectors, and save the model so we can easily load again.
	# Export models to tsv, export vectors, and save
	save_models(models,base_dir)
	export_models_tsv(models,base_dir)
	export_vectors(models,output_dir=vector_dir)
I want to note that I used gensim for learning and some methods. The work and examples from Dato are great!
Working with models
Wordfish provides functions for easily loading a model that is generated from a corpus:
model = load_models(base_dir)["neurosynth"]You can then do simple things, like find the most similar words for a query word:
	model.most_similar("anxiety")
	# [('aggression', 0.77308839559555054),
	#   ('stress', 0.74644440412521362),
	#   ('personality', 0.73549789190292358),
	#   ('excessive', 0.73344630002975464),
	#   ('anhedonia', 0.73305755853652954),
	#   ('rumination', 0.71992391347885132),
	#   ('distress', 0.7141801118850708),
	#   ('aggressive', 0.7049030065536499),
	#   ('craving', 0.70202392339706421),
	#   ('trait', 0.69775849580764771)]
It’s easy to see that corpus context is important - here is finding similar terms for the “reddit” corpus:
	model = load_models(base_dir)["reddit"]
	model.most_similar("anxiety")
	# [('crippling', 0.64760375022888184),
	# ('agoraphobia', 0.63730186223983765),
	# ('generalized', 0.61023455858230591),
	# ('gad', 0.59278655052185059),
	# ('hypervigilance', 0.57659250497817993),
	# ('bouts', 0.56644737720489502),
	# ('depression', 0.55617612600326538),
	# ('ibs', 0.54766887426376343),
	# ('irritability', 0.53977066278457642),
	# ('ocd', 0.51580017805099487)]
Here are examples of performing addition and subtraction with vectors:
	model.most_similar(positive=['anxiety',"food"])
	# [('ibs', 0.50205761194229126),
	# ('undereating', 0.50146859884262085),
	# ('boredom', 0.49470821022987366),
	# ('overeating', 0.48451068997383118),
	# ('foods', 0.47561675310134888),
	# ('cravings', 0.47019645571708679),
	# ('appetite', 0.46869537234306335),
	# ('bingeing', 0.45969703793525696),
	# ('binges', 0.44506731629371643),
	# ('crippling', 0.4397256076335907)]

	model.most_similar(positive=['bipolar'], negative=['manic'])
	# [('nos', 0.36669495701789856),
	# ('adhd', 0.36485755443572998),
	# ('autism', 0.36115738749504089),
	# ('spd', 0.34954413771629333),
	# ('cptsd', 0.34814098477363586),
	# ('asperger', 0.34269329905509949), ('schizotypal', 0.34181860089302063), ('pi', 0.33561226725578308), ('qualified', 0.33355745673179626), ('diagnoses', 0.32854354381561279)]

	model.similarity("anxiety","depression")
	#0.67751728687122414

	model.doesnt_match(["child","autism","depression","rett","cdd","young"])
	#'depression'
And to get the raw vector for a word:
model["depression"]Extracting term similarities
To extract a pairwise similarity matrix, you can use the function
extract_similarity_matrix. These are the data driven relationships between terms that the Wordfish infrastructure provides:# Extract a pairwise similarity matrix wordfish_sims = extract_similarity_matrix(models["neurosynth"])Classification
Finally, here is an example of predicting neurosynth abtract labels using the pubmed neurosynth corpus. We first want to load the model and meta data for neurosynth, meaning labels for each text:
	model = load_models(base_dir,"neurosynth")["neurosynth"]
	meta = get_meta(base_dir)["neurosynth"]
We can then use the
featurize_to_corpusmethod to get labels and vectors from the model, and thebuild_svmfunction to build a simple, cross validated classified to predict the labels from the vectors:vectors,labels = featurize_to_corpus(model,meta) classifiers = build_svm(vectors=vectors,labels=labels,kernel="linear")The way this works is to take a new post from reddit with an unknown label, use the Word2vec word embeddings vector as a lookup, and generating a vector for the new post based on taking the mean vector of word embeddings. It’s a simple approach, could be improved upon, but it seemed to work reasonably well.
Classification of Disorder Using Reddit
A surprisingly untapped resource are Reddit boards, a forum with different “boards” indicating a place to write about topics of interest. It has largely gone unnoticed that individuals use Reddit to seek social support for advice, for example, the Depression board is predominantly filled with posts from individuals with Depression writing about their experiences, and the Computer Science board might be predominantly questions or interesting facts about computers or being a computer scientist. From the mindset of a research scientist who might be interested in Reddit as a source of language, a Reddit board can be thought of as a context. Individuals who post to the board, whether having an “official” status related to the board, are expressing language in context of the topic. Thus, it makes sense that we can “learn” a particular language context that is relevant to the board, and possibly use the understanding of this context to identify it in other text. Thus, I built 36 word embedding models across 36 Reddit boards, each representing the language context of the board, or specifically, the relationships between the words. I used these models to look at context of words across different boards. I also build one master “reddit” model, and used this model in the classification framework discussed previously.
For the classification framework, it was done for two applications - predicting reddit boards from reddit posts, and doing the same, but using the neurosynth corpus as the Word2Vec model (the idea being that papers about cognitive neuroscience and mental illness might produce word vectors that are more relevant for reddit boards about mental illness groups). For both of these, the high level idea is that we want to predict a board (grouping) based on a model built from all of reddit (or some other corpus). The corpus used to derive the word vectors gives us the context - meaning the relationships between terms (and this is done across all boards with no knowledge of classes or board types), and then we can take each entry and calculate an average vector for it based on averaging the vectors of word embeddings that are present in the sentence. Specifically we:
1) generate word embeddings model (M) for entire reddit corpus (resulting vocabulary is size N=8842)

2) For each reddit post (having a board label like "anxiety":

    - generate a vector that is an average of word embeddings in M
Then for each pairwise board (for example, “anxiety” and “atheist”
1) subset the data to all posts for “anxiety” and “atheist”
2) randomly hold out 20% for testing, rest 80% for training
3) build an SVM to distinguish the two classes, for each of rbf, linear, and poly kernel
4) save accuracy metricsResults
How did we do?
Can we classify reddit posts?
The full result has accuracies that are mixed. What we see is that some boards can be well distinguished, and some not. When we extend to use the neurosytnh database to build the model, we don’t do as well, likely because the corpus is much smaller, and we remember from the paper that larger corpus tends to do better.
Can we classify neurosynth labels?
A neurosynth abstract comes with a set of labels for terms that are (big hand waving motions) “enriched.” Thus,given labels for a paragraph of text (corresponding to the neurosynth term) I should be able to build a classifier that can predict the term. The procedure is the same as above: an abstract is represented as its mean of all the word embeddings represented. The results are also pretty good for a first go, but I bet we could do batter with a multi-class model or approach.
Do different corpus provide different context (and thus term relationships?)
This portion of the analysis used the Word2Vec models generated for specific reddit boards. Before I delved into classification, I had just wanted to generate matrices that show relationships between words, based on a corpus of interest. I did this for NeuroSynth, as well as for a large sample (N=121862) reddit posts across 34 boards, including disorders and random words like “politics” and “science.” While there was interesting signal in the different relationship matrices, really the most interesting thing we might look at is how a term’s relationships varies on the context. Matter of fact, I would say context is extremely important to think about. For example, someone talking about “relationships” in the context of “anxiety” is different than someone talking about “relationships” in the context of “sex” (or not). I didn’t upload these all to github (I have over 3000, one for each neurosynth term), but it’s interesting to see how a particular term changes across contexts.
Each matrix (pdf file) in the folder above is one term from neurosynth. What the matrix for a single term shows is different contexts (rows) and the relationship to all other neurosynth terms (columns). Each cell value shows the word embedding of the global term (in the context specified) against the column term. The cool thing for most of these is that we see general global patterns, meaning that the context is similar, but then there are slight differences. I think this is hugely cool and interesting and could be used to derive behavioral phenotypes. If you would like to collaborate on something to do this, please feel free to send me an email, tweet, Harry Potter owl, etc.
Conclusions
Wordfish provides standard data structures and an easy way to extract terms, corpus, and perform a classification analysis, or extract similarity matrices for terms. It’s missing a strong application. We don’t have anything suitable in cognitive neuroscience, at least off the bat, and if you might have ideas, I’d love to chat. It’s very easy to write a plugin to extend the infrastructure to another terminology or corpus. We can write one of those silly paper things. Or just have fun, which is much better. The application to deploy Wordfish plugins, and the plugins themselves are open source, meaning that they can be collaboratively developed by users. That means you! Please contribute!.
Limitations
The limitations have to do with the fact that this is not a finished application. Much fine tuning could be done toward a specific goal, or to answer a specific question. I usually develop things with my own needs in mind, and add functionality as I go and it makes sense.
Database
For my application, it wasn’t a crazy idea to store each corpus entry as a text file, and I had only a few thousand terms. Thus, I was content using flat text files to store data structures. I had plans for integration of “real” databases, but the need never arose. This would not be ideal for much larger corpus, for which using a database would be optimal. Given the need for a larger corpus, I would add this functionality to the application, if needed.
Deployment Options
Right now the only option is to generate a folder and install on a cluster, and this is not ideal. Better would be options to deploy to a local or cloud-hosted virtual machine, or even a Docker image. This is another future option.
Data
It would eventually be desired to relate analyses to external data, such as brain imaging data. For example, NeuroVault is a database of whole-brain statistical maps with annotations for terms from the cognitive atlas, and we may want to bring in maps from NeuroVault at some point. Toward this aim a separate wordfish-data repo has been added. Nothing has been developed here yet, but it’s in the queue.
And this concludes my first un-paper paper. It took an afternoon to write, and it feels fantastic. Go fish!
· -
So Badly
I want it so badly, I can’t breathe. The last time I had this feeling was right after interviewing at Stanford. My heart ached for the realization that the opportunity to learn informatics was everything I had ever wanted, and the chances were so slim of getting it. Before I had any prowess in programming and didn’t know what a normal distribution was, I had the insight that immersion in the right environment would push and challenge me exactly in the way I was hungry for. It is only when we surround ourselves by individuals who are more skilled, and in an environment with opportunity to try new things and take risks, that we grow in skill and in ourselves. When I compare the kind of “things” that I tried to build back in my first quarter to what I build now, I have confidence that I was right about this particular instinct. Now, in my last year or so of graduate school, I am again faced with uncertainty about the future. I am almost thirty - I feel so old, and in this context a part of me is tired of constantly needing to prove that I am good enough. I am defined by what I like to call the goldfish property. I am so devoted to the things that I love, mainly learning about new infrastructures and creating beautiful applications, and my stubborness is so great that I will tend to grow toward the size of my tank. I have the confidence that, despite at any moment not having prowess in some domain, if presented with challenge, and especially in an environment where I can observe the bigger fish, I will grow. What scares me is the fact that in order to gain entry to the larger ocean, we are judged as little fish. I am also terrified by a general realization about the importance of the choice of an environment. Each step slightly away from being around the kind of people that are amazing at the things I want to be amazing at is a small dimming of the light insight my heart, and too many steps away means a finality of regret and a present life of doing some sets of tasks that, maybe one might be good at, but they do not satisfy the heart.
This is why this crucial next step is so terrifying. I have confidence in the things that I want to be amazing at. I’m also a weird little fish, I don’t care about pursuring weekend fun, going on trips, learning about different cultures, or even starting a family. I just want to immerse my brain in a computer and build things. The challenges that I want are building infrastructure, meaning databases, cluster and cloud environments, virtual machines… essentially applications. I go nuts over using version control (Github), APIs, Continuous Integration, and working on software projects. I like to think about data structures, and standards, and although my training in machine learning supplements that, and I enjoy learning new algorithms that I can use in my toolbox, I don’t have drive to find ways to better optimize those algorithms. I want to be the best version of myself that I can possibly be - to return home at the end of each day and feel that I’ve milked out every last ounce of energy and effort is the ultimate satisfaction. I want to be able to build anything that I can dream of. To have and perform some contained skillset is not good enough. I don’t think I’ll ever feel good enough, and although this can sometimes sound disheartening, is the ultimate driver towards taking risks to try new things that, when figured out, lead to empowerment and joy. The terrifying thing about remaining in a small research environment is that I won’t be pushed, or minimally have opportunity, to become a badass at these things. I might use them, but in context of neuroscientists or biologists, to already feel like one of the bigger fish in using these technologies fills me with immense sadness. I’m perhaps proficient in neuroscience, but I’m not great because I’m more interested in trying to build tools that neuroscientists can use. Any individual can notice this in him or herself. We tend to devote time and energy to the things that we obsessively love, and while the other things might be necessary to learn or know, it’s easy to distinguish these two buckets because one grows exponentially, effortlessly, and the other one changes only when necessary. Growing in this bucket is an essential need, critical for happiness and fulfillment, and to slow down this growth and find oneself in a job performing the same skill set with no opportunity for growth leads to screaming inside ones head, and feeling trapped.
So, in light of this uncertainty, and upcoming change, I feel squirmy. I want to be an academic software engineer, but if I am rooted in academia I am worried about being a big fish, and I would not grow. I am an engineer at heart, and this does not line up with the things that an individual in academia is hungry to learn, which are more rooted in biological problems than the building of things. However, if I were to throw myself into some kind of industry, I feel like I am breaking a bond and established relationship and trust with the people and problems that I am passionate about solving. I love academia because it gives me freedom to work on different and interesting problems every day, freedom and control over my time and work space, and freedom to work independently. But on the other hand, it is much more challenging to find people that are great at the kinds of modern technologies that I want to be great at. It is much less likely to be exposed to the modern, bleeding edge technology that I am so hungry to learn, because academia is always slightly behind, and the best I can do is read the internet, and watch conference videos for hours each evening, looking for tidbits of cool things that I can find an excuse to try in some research project. Academia is also painfully slow. There is a pretty low bar for being a graduate student. We just have to do one thesis project, and it seems to me that most graduate students drag their feet to watch cells grow in petri dishes, complain about being graduate students, and take their sweet time supplemented with weekend trips to vineyards and concerts in San Francisco. I’ve said this before, but if a graduate student only does a single thesis project, unless it is a cure for cancer, I think they have not worked very hard. I also think it’s unfortunate that someone who might have been more immersed not get chosen in favor of someone else that was a better interviewer. But I digress. The most interesting things in graduate school are the projects that one does for fun, or the projects that one helps his or her lab with, as little extra bits. But these things still feel slow at times, and the publication process is the ultimate manifestation of this turtleness. When I think about this infrastructure, and that the ultimate products that I am to produce are papers, this feels discouraging. Is that the best way to have an impact, for example, in reproducible science? It seems that the sheer existence of Github has done more for reproducibility across all domains than any published, academic efforts. In that light, perhaps the place to solve problems in academia is not in academia, but at a place like Github. I’m not sure.
This dual need for a different environment and want to solve problems in a particular domain makes it seem like I don’t have any options. The world is generally broken into distinct, “acceptable” and well paved paths for individuals. When one graduates, he or she applies for jobs. The job is either in academia or industry. It is well scoped and defined. Many others have probably done it before, and the steps of progression after entry are also logical. In academia you either move through postdoc-ship into professor-dome, or you become one of those things called a “Research Associate” which doesn’t seem to have an acceptable path, but is just to say “I want to stay in academia but there is no real proper position for what I want to do, so this is my only option.” What is one to do, other than to create a list of exactly the things to be desired in a position, and then figure out how to make it? The current standard options feel lacking, and choosing either established path would not be quite right. If I were to follow my hunger to learn things more rooted in a “building things” direction, this would be devastating in breaking trust and loyalty with people that I care a lot about. It also makes me nervous to enter a culture that I am not familiar with, namely the highly competitive world of interviewing for some kind of engineering position. The thought of being a little fish sits on my awareness and an overwhelming voice says “Vanessa, you aren’t good enough.” And then a tiny voice comes in and questions that thought, and says, “Nobody is good enough, and it doesn’t matter, because that is the ocean where you will thrive. You would build amazing things.” But none of that matters if you are not granted entry into the ocean, and this granting is no easy thing. It is an overwhelming, contradictory feeling. I want to sit in a role that doesn’t exist - this academic software developer, there is no avenue to have the opportunities and environment of someone that works at a place like Google but still work on problems like reproducible science. I don’t know how to deal with it at this point, and it is sitting on my heart heavily. I perhaps need to follow my own instinct and try to craft a position that does not exist, one that I know is right. I must think about these things.
· -
The Academic Software Developer
To say that I have very strong feelings about standards and technology used in academic research would be a gross understatement. Our current research practices and standards for publication, sharing of data and methods, and reproducible science are embarrassingly bad, and it’s our responsibility to do better. As a gradate student, it seemed that the “right place” to express these sentiments would be my thesis, and so I poured my heart out into some of the introduction and later chapters. It occurred to me that writing a thesis, like many standard practices in academia, is dated to be slow and ineffective - a document that serves only to stand as a marker in time to signify completion of some epic project, to only have eyes laid upon it by possibly 4-6 people, and probably not even that many, as I’ve heard stories of graduate students getting away with copy pasting large amounts of nonsense between an introduction and conclusion and getting away with it. So should I wait many months for this official pile of paper to be published to some Stanford server to be forgotten about before it even exists? No thanks. Let’s talk about this here and now.
This reproducibility crisis comes down to interpretation - the glass can be half full or half empty, but it doesn’t really matter because at the end of the day we just need to pour more water in the stupid glass, or ask why we are wasting out time evaluating and complaining about the level of water when we could be digging wells. The metric itself doesn’t even matter, because it casts a shadow of doubt not only on our discoveries, but on our integrity and capabilities of scientists. Here we are tooting on about “big data” and publishing incremental changes to methods when what we desperately is need paradigm shifts in the most basic, standard practices for conducting sound research. Some people might throw their hands up and say “It’s too big of a problem for me to contribute.” or “The process is too political and it’s unlikely that we can make any significant change.” I would suggest that change will come slowly by way of setting the standard through example. I would also say that our saving grace will come by way of leadership and new methods and infrastructure to synthesize data. Yes, our savior comes by way of example from software development and informatics.
Incentives for Publication
It also does not come as a surprise that the incentive structure for conducting science and publishing is a little broken. The standard practice is to aggressively pursue significant findings to publish, and if it’s not significant, then it’s not sexy, and you can file it away in the “forgotten drawer of shame.” In my short time as a graduate student, I have seen other graduate students, and even faculty anguish over the process of publication. I’ve seen graduate students want to get out as quickly as possible, willing to do just about anything “for that one paper.” The incentive structure renders otherwise rational people into publication-hungry wolves that might even want to turn garbage into published work by way of the science of bullshit. As a young graduate student it is stressful to encounter these situations and know that it goes against what you consider to be a sound practice of science. It is always best to listen to your gut about these things, and to pursue working with individuals that have the highest of standards. This is only one of the reasons that Poldrack Lab is so excellent. But I digress. Given that our incentives are in check, what about the publications themselves?
Even when a result makes it as far as a published paper, the representation of results as static page does not stand up to our current technological capabilities. Why is it that entire careers can be made out of parsing Pubmed to do different flavors of meta-analysis, and a large majority of results seem to be completely overlooked or eventually forgotten? Why is a result a static thing that does not get updated as our understanding of the world, and availability of data, changes? We pour our hearts out into these manuscripts, sometimes making claims that are larger than the result itself, in order to make the paper loftier than it actually is. While a manuscript should be presented with an interesting story to capture the attention of others who may not have interest in a topic, it still bothers me that many results can be over-sensationalized, and other important results, perhaps null or non significant findings, are not shared. Once the ink has dried on the page, the scientist is incentivized to focus on pursuit on the next impressive p-value. In this landscape, we don’t spend enough time thinking about reproducible science. What does it mean, computationally, to reproduce a result? Where do I go to get an overview of our current understanding for some question in a field without needing to read all published research since the dawn of time? It seems painfully obvious to me that continued confidence in our practice of research requires more standardization and best practices for methods and infrastructure that lead to such results. We need informed ways to compare a new claim to everything that came before it.
Lessons from Software Development and Informatics
Should this responsibility for a complete restructuring of practices, the albatross for the modern scientist, be his burden? Probably this is not fair. Informatics, a subset of science that focuses on the infrastructure and methodology of a scientific discipline, might come to his aid. I came into this field because I’m not driven by answering biological questions, but by building tools. I’ve had several high status individuals tell me at different times that someone like myself does not belong in a PhD program, and I will continue to highly disagree. There is a missing level across all universities, across all of academia, and it is called the Academic Software Developer. No one with such a skillset in their right mind would stay in academia when they could be paid two to three fold in industry. Luckily, some of us either don’t have a right mind, or are just incredibly stubborn about this calling that a monetary incentive structure is less important than the mission itself. We need tools to both empower researchers to assess the reproducibility of their work, and to derive new reproducible products. While I will not delve into some of the work I’ve done in my graduate career that is in line with this vision (let’s save that for thesis drivelings), I wlll discuss some important observations about the academic ecosystem, and make suggestions for current scientists to do better.
Reproducibility and Graduate Students
Reproducibility goes far beyond the creation of a single database to deposit results. Factors such as careful documentation of variables and methods, how the data were derived, and dissemination of results unify to embody a pattern of sound research practices that have previously not been emphasized. Any single step in an analysis pipeline that is not properly documented, or does not allow for a continued life cycle of a method or data, breaks reproducibility. If you are a graduate student, is this your problem? Yes it is your problem. Each researcher must think about the habits and standards that he or she partakes in from the initial generation of an idea through the publishing of a completed manuscript. On the one hand, I think that there is already a great burden on researchers to design sound experiments, conduct proper statistical tests, and derive reasonable inferences from those tests. Much of the disorganization and oversight to sound practices could be resolved with the advent of better tools such as resources for performing analysis, visualizing and capturing workflows, and assessing the reproducibility of a result. On the other hand, who is going to create these tools? The unspoken expectation is that “This is someone else’s problem.” Many seem to experience tunnel vision during graduate school. There is no reality other than the individual’s thesis, and as graduate students we are protected from the larger problems of the community. I would argue that the thesis is rather trivial, and if you spend most of your graduate career working on just one project, you did not give the experience justice. I don’t mean to say that the thesis is not important, because graduation does not happen without its successful completion. But rather, graduate school is the perfect time to throw yourself into learning, collaborating on projects, and taking risks. If you have time on the weekends to regularly socialize, go to vineyards, trips, and consistently do things that are not obsessively working on the topic(s) that you claimed to be passionate about when applying, this is unfortunate. If you aim to get a PhD toward the goal of settling into a comfy, high income job that may not even be related to your research, unless you accomplished amazing things during your time as a young researcher, this is also unfortunate. The opportunity cost of these things is that there is probably someone else in the world that would have better taken advantage of the amazing experience that is being a graduate student. The reason I bring this up is because we should be working harder to solve these problems. With this in mind, let’s talk about tiny things that we can do to improve how we conduct research.
The components of a reproducible analysis
A reproducible analysis, in its truest definition, must be easy to do again. This means several key components for the creation and life cycle of the data and methods:
- complete documentation of data derivation, analysis, and structure
- machine accessible methods and data resources
- automatic integration of data, methods, and standards
A truly reproducible analysis requires the collection, processing, documentation, standardization, and sound evaluation of a well-scoped hypothesis using large data and openly available methods. From an infrastructural standpoint this extends far beyond requiring expertise in a domain science and writing skills, calling for prowess in high performance computing, programming, database and data structure generation and management, and web development. Given initiatives like the Stanford Center for Reproducibile Neuroscience, we may not be too far off from “reproducibility as a service.” This does not change the fact that reproducibility starts on the level of the individual researcher.
Documentation
While an infrastructure that manages data organization and analysis will immediately provide documentation for workflow, this same standard must trickle into the routine of the average scientist before and during the collection of the input data. The research process is not an algorithm, but rather a set of cultural and personal customs that starts from the generation of new ideas, and encompasses preferences and style in reading papers and taking notes, and even personal reflection. Young scientists learn through personal experience and immersion in highly productive labs with more experienced scientists to advise their learning. A lab at a prestigious University is like a business that exists only by way of having some success with producing research products, and so the underlying assumption is that the scientists in training should follow suit. The unfortunate reality is that the highly competitive nature of obtaining positions in research means that the composition of a lab tends to weigh heavily in individuals early in their research careers, with a prime focus on procuring funding for grants to publish significant results to find emotional closure in establishing security of their entire life path thus far. In this depiction of a lab, we quickly realize that the true expertise comes by way of the Principle Investigator, and the expectation of a single human being to train his or her entire army while simultaneously driving innovative discovery in his or her field is outrageous. Thus, it tends to be the case that young scientists know that it’s important to read papers, take notes, and immerse themselves in their passion, but their method of doing this comes by way of personal stumbling to a local optimum, or embodying the stumbling of a slightly larger fish.
Levels of Writing
A distinction must be made between a scientist pondering a new idea, to testing code for a new method, to archiving a procedure for future lab-mates to learn from. We can define different levels of writing based on the intended audience (personal versus shared), and level of privacy (private versus public). From an efficiency standpoint, the scientist has much to gain by instilling organization and recording procedure in personal learning and data exploration, whether it be public or private. A simple research journal means a reliable means to quickly turn around and turn a discovery into a published piece of work. This is an example of personal work, and private may mean that it is stored on an individual’s private online Dropbox, Box, or Google Drive, and public may mean that it is written about on a personal blog or forum. Keeping this kind of documentation, whether it is private or public, can help an individual to keep better track of ideas and learning, and be a more efficient researcher. Many trainees quickly realize the need to record ideas, and stumble on a solution without consciously thinking ahead to what kind of platform would best integrate with a workflow, and allow for future synthesis and use of the knowledge that is recorded.
In the case of shared resources, for computational labs that work primarily with data, an online platform with appropriate privacy and backup is an ideal solution over more fragile solutions such as paper or documents on a local machine. The previously named online platforms for storing documents (Box, Dropbox, and Google Drive), while not appropriate for PI or proprietary documents, are another reasonable solution toward the goal of shared research writing. These platforms are optimized for sharing amongst a select group, and again without conscious decision making, are commonly the resources that lab’s used in an unstructured fashion.
Documentation of Code
In computational fields, it is typically the case that the most direct link to reproducing an analysis is not perusing through research prose, but by way of obtaining the code. Writing is just idealistic idea and hope until someone has programmed something. Thus, a researcher in a computational field will find it very hard to be successful if he or she is not comfortable with version control. Version control keeps a record of all changes through the life cycle of a project. It allows for the tagging of points in time to different versions of a piece of software, and going back in time. These elements are essential for reproducible science practices that are based on sharing of methods and robust documentation of a research process. It takes very little effort for a researcher to create an account with a version control service (for example, http://www.github.com), and typically the biggest barriers to this practice are cultural. A researcher striving to publish novel ideas and methods is naturally going to be concerned over sharing ideas and methods until they have been given credit for them. It also seems that researchers are terrified of others finding mistakes. I would argue if the process is open and transparent, coding is collaborative, and peer review includes review of code, finding a bug (oh, you are a human and make mistakes every now and then?) is rather trivial and not to be feared. This calls for a change not only in infrastructure, but research culture, and there is likely no way to do that other than by slow change of incentives and example over time. It should be natural for a researcher, when starting a new project, to immediately create a repository to organize its life-cycle. While we cannot be certain that services like Github, Bitbucket, and Sourceforge are completely reliable and will exist into infinitum, this basic step can minimally ensure that work is not lost to a suddenly dead hard-drive, and methods reported in the text of a manuscript can be immediately found in the language that produced the result. Researchers have much to gain in being able to collaboratively develop methods and thinking by way of slowly gaining expertise in using these services. If a computational graduate student is not using and established in using Github by the end of his or her career, this is a failure in his or her training as a reproducible scientist.
On the level of documentation in the code itself, this is often a personal, stylistic process that varies by field. An individual in the field of computer science is more likely to have training in algorithms and proper use of data structures and advanced programming ideas, and is more likely to produce computationally efficient applications based on bringing together a cohesive set of functions and objects. We might say this kind of research scientist, by way of choosing to study computer science to begin with, might be more driven to develop tools and applications, and unfortunately for academia will ultimately be most rewarded for pursuing a job in industry. This lack of “academic software developers,” as noted previously, is arguably the prime reason that better, domain-specific, tools do not exist for academic researchers. A scientist that is more driven to answer biological questions sees coding as a means to procure those answers, and is more likely to produce batch scripts that use software or functions provided by others in the field. In both cases, we gripe over “poorly documented” code, which on the most superficial level suggests that the creator did not add a proper comment to each line explaining what it means. An epiphany that sometimes takes years to realize is the idea that documentation of applications lives in the code itself. The design, choice of variable names and data structures, spacing of the lines and functions, and implementation decisions can render a script easy to understand, or a mess of characters that can only be understood by walking through each line in an interactive console. Scientists in training, whether aiming to build elegant tools or simple batch scripts, should be aware of these subtle choices in the structure of their applications. Cryptic syntax and non-intuitive processes can be made up for with a (sometimes seemingly) excessive amount of commenting. The ultimate goal is to make sure that a researcher’s flow of thinking and process is sufficiently represented in his programming outputs.
Documentation Resources for Scientists
A salient observation is that these are all service oriented, web-based tools. The preference for Desktop software such as Microsoft Word or Excel is founded on the fact that Desktop software tends to provide better user experience (UI) and functionality. However, the current trend is that the line is blurring between Desktop and browser, and with the growing trend of browser-based offline tools that work with or without an internet connection, it is only a matter of time until there will be no benefit to using a Desktop application over a web-based one. Research institutions have taken notice of the benefit of using these services for scientists, and are working with some of these platforms to provide “branded” versions for their scientists. Stanford University provides easy access to wikis, branded “Box” accounts for labs to share data, along with interactive deployment of Wordpress blogs for individuals and research groups to deploy blogs and websites for the public. Non-standard resources might include an online platform for writing and sharing LaTex documents http://www.overleaf.com, for collecting and sharing citations (http://www.paperpile.com, http://www.mendeley.com), and for communicating about projects and daily activity (http://www.slack.com) or keeping track of projects and tasks (http://www.asana.com).
This link between local and web-based resource continues to be a challenge that is helped with better tools. For example, automated documentation tools (e.g., Sphinx for Python) can immediately transform comments hidden away in a Github repository into a clean, user friendly website for reading about the functions. Dissemination of a result, to both other scientists and the public, is just as important (if not more important) than generation of the result, period. An overlooked component toward understanding of a result is providing the learner with more than a statistical metric reported in a manuscript, but a cohesive story to put the result into terms that he or she can relate to. The culture of publication is to write in what sounds like “research speak,” despite the fact that humans learn best by way of metaphor and story. What this means is that it might be common practice to, along with a publication, write a blog post and link to it. This is not to say that results should be presented as larger than they really are, but put into terms that are clear and undertandable for someone outside of the field. Communication about results to other researchers and the public is an entire thesis in itself, but minimally scientists must have power to relate their findings to the world via an internet browser. Right now, that means a simple text report and prose to accompany a thought, or publication. Our standards for dissemination of results should reflect modern technology. We should have interactive posters for conferences, theses and papers immediately parsed for sophisticated natural language processing applications, and integration of social media discussion and author prose to accompany manuscripts. A scientist should be immediately empowered to publish a domain-specific web report that includes meaningful visualization and prose for an analysis. It might be interactive, including the most modern methods for data visualization and sharing. Importantly, it must integrate seamlessly into the methodology that it aims to explain, and associated resources that were used to derive it. It’s up to us to build these tools. We will try many times, and fail many times. But each effort is meaningful. It might be a great idea, or inspire someone. We have to try harder, and we can use best practices from software development to guide us.
The Academic Software Developer
The need for reproducible science has brought with it the emerging niche of the “academic software developer,” an individual that is a combined research scientist and full stack software developer, and is well suited to develop applications for specific domains of research. This is a space that exists between research and software development, and the niche that I choose to operate in. The Academic Software Developer, in the year 2016, is thinking very hard about how to integrate large data, analysis pipelines, and structured terminology and standard into web-friendly things. He or she is using modern web technology including streaming data, server side JavaScript, Python frameworks and cloud resources, and Virtual Machines. He or she is building and using Application Programming Interfaces, Continuous Integration, and version control. Speaking personally, I am continually experimenting with my own research, continually trying new things and trying to do a little bit better each time. I want to be a programming badass, and have ridiculous skill using Docker, Neo4j, Web Components, and building Desktop applications to go along with the webby ones. It is not satisfying to stop learning, or to see such amazing technology being developed down the street and have painful awareness that I might never be able to absorb it all. My work can always be better, and perhaps the biggest strength and burden of having such stubbornness is this feeling that efforts are never good enough. I think this can be an OK way to be only given the understanding that it is ok for things to not work the first time. I find this process of learning, trying and failing, and trying again, to be exciting and essential for life fulfillment. There is no satisfaction at the end of the day if there are not many interesting, challenging problems to work on.
I don’t have an “ending” for this story, but I can tell you briefly what I am thinking about. Every paper should be associated with some kind of “reproducible repo.” This could mean one (or more) of several things, depending on the abilities of the researcher and importance of the result. It may mean that I can deploy an entire analysis with the click of a button, akin to the recently published MyConnectome Project. It may mean that a paper comes with a small web interface linking to a database and API to access methods and data, as I attempted even for my first tiny publication. It could be a simple interactive web interface hosted with analysis code on a Github repo to explore a result. We could use continuous integration outside of its scope to run an analysis, or programatically generate a visualization using completely open source data and methods (APIs). A published result is almost useless if care is not taken to make it an actionable, implementable thing. I’m tired of static text being the output of years of work. As a researcher I want some kind of “reactive analysis” that is an assertion a researcher makes about a data input answering some hypothesis, and receiving notification about a change in results when the state of the world (data) changes. I want current “research culture” to be more open to business and industry practice of using data from unexpected places beyond Pubmed and limited self-report metrics that are somehow “more official” than someone writing about their life experience informally online. I am not convinced that the limited number of datasets that we pass around and protect, not sharing until we’ve squeezed out every last inference, are somehow better than the crapton of data that is sitting right in front of us in unexpected internet places. Outside of a shift in research culture, generation of tools toward this vision is by no means an easy thing to do. Such desires require intelligent methods and infrastructure that must be thought about carefully, and built. But we don’t currently have these things, and we are already way fallen behind the standard in industry that probably comes by way of having more financial resources. What do we have? We have ourselves. We have our motivation, and skillset, and we can make a difference. My hope is that other graduate students have equivalent awareness to take responsibility for making things better. Work harder. Take risks, and do not be complacent. Take initiative to set the standard, even if you feel like you are just a little fish.
· -
Got Santa on the Brain?
Got Santa on the Brain? We do at Poldracklab! Ladies and gentlemen, we start with a nice square Santa:

We convert his colors to integer values…
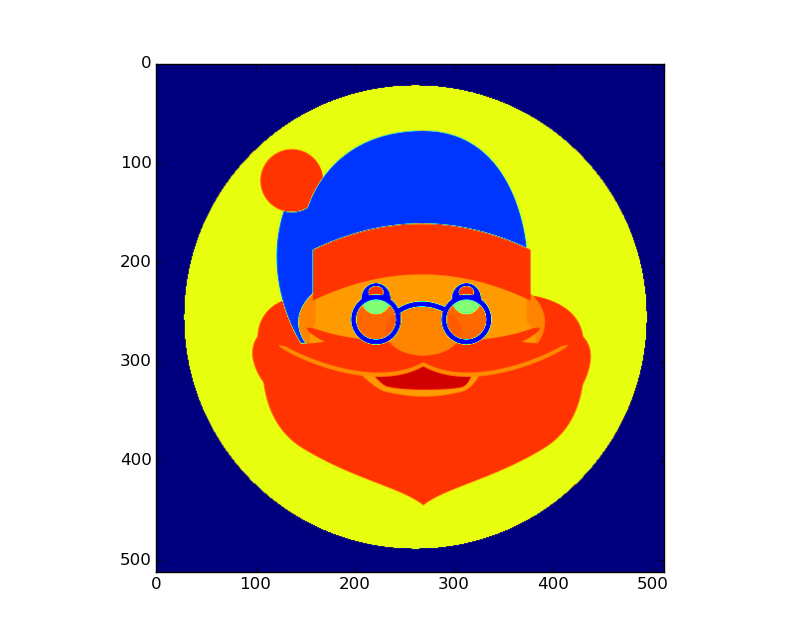
And after we do some substantial research on the christmas spirit network, we use our brain science skills and…
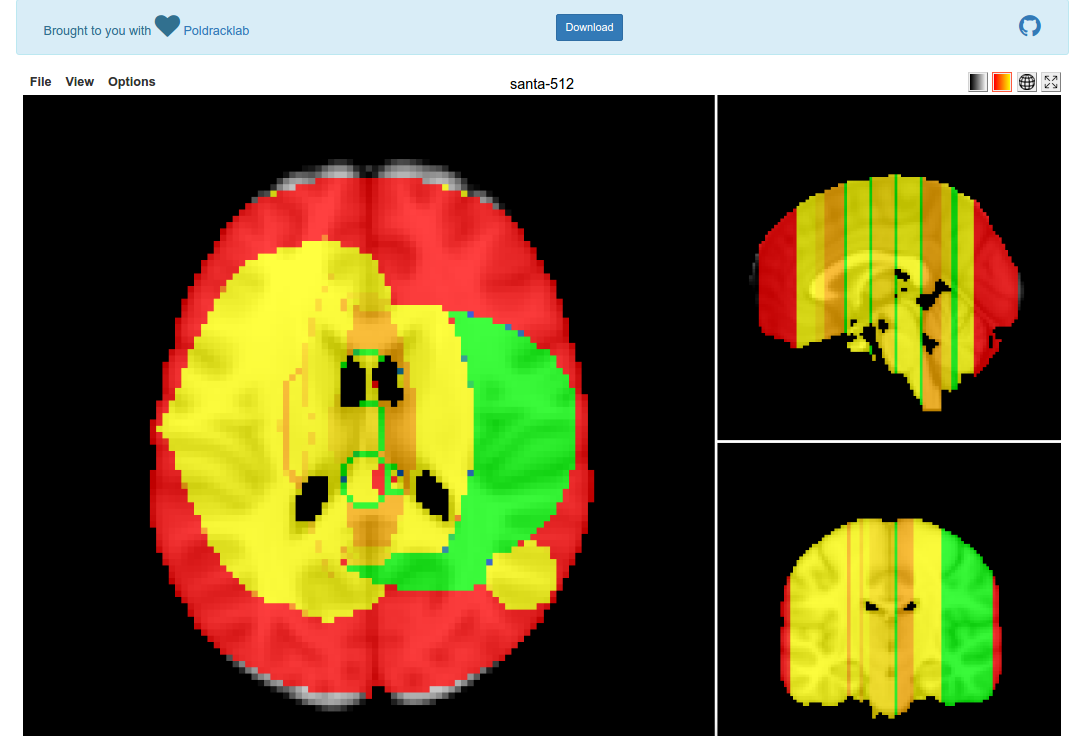
We’ve found the Christmas Spirit Network!
What useless nonsense is this?
I recently had fun generating photos from tiny pictures of brains, and today we are going to flip that on its head (artbrain!). My colleague had an idea to do something spirited for our NeuroVault database, and specifically, why not draw pictures onto brainmaps? I thought this idea was excellent. How about a tool that can do it? Let’s go!
Reading Images in Python
In my previous brainart I used the standard PIL library to read in a jpeg image, and didn’t take any attention to the reality that many images come with an additional fourth dimension, an “alpha” layer that determines image transparency. This is why we can have transparency in a png, and not in a jpg, at least per my limited undertanding. With this in mind, I wanted to test in different ways for reading png, and minimally choosing to ignore the transparency. We can use the PyPNG to read in the png:
    import numpy
    import png
    import os
    import itertools

    pngReader=png.Reader(filename=png_image)
    row_count, column_count, pngdata, meta = pngReader.asDirect()
In the “meta” variable, this is a dictionary that holds different meta data about the image:
    meta
     {'alpha': True,
      'bitdepth': 8,
      'greyscale': False,
      'interlace': 0,
      'planes': 4,
      'size': (512, 512)}

    bitdepth=meta['bitdepth']
    plane_count=meta['planes']
Right off the bat this gives us a lot of power to filter or understand the image that the user chose to read in. I’m going to not be restrictive and let everything come in, because I’m more interested in the errors that might be triggered. It’s standard practice to freak out when we see an error, but debugging is one of my favorite things to do, because we can generally learn a lot from errors. We then want to use numpy to reshape the image into something that is intuitive to index, with (X,Y,RGBA)
    image_2d = numpy.vstack(itertools.imap(numpy.uint16, pngdata))
    # If "image_plane" == 4, this means an alpha layer, take 3 for RGB
    for row_index, one_boxed_row_flat_pixels in enumerate(pngdata):
        image_2d[row_index,:]=one_boxed_row_flat_pixels
    image_3d = numpy.reshape(image_2d,(row_count,column_count,plane_count))
The
pngdatavariable is an iterator, which is why we can enumerate over it. If you want to look at one piece in isolation when you are testing this, after generating the variable you can just do:pngdata.next()To spit it out to the console. Then when we want to reference each of the Red, Green, and Blue layers, we can do it like this:
    R = image_3d[:,:,0]
    G = image_3d[:,:,1]
    B = image_3d[:,:,2]
And the alpha layer (transparency) is here:
A = image_3d[:,:,4]Finally, since we want to map this onto a brain image (that doesn’t support different color channels) I used a simple equation that I found on StackOverflow to convert to integer value:
    # Convert to integer value
    rgb = R;
    rgb = (rgb << 8) + G
    rgb = (rgb << 8) + B
For the final brain map, I normalized to a Z score to give positive and negative values, because then using the Papaya Viewer the default will detect these positive and negative, and give you two choices of color map to play with. Check out an example here, or just follow instructions to make one yourself! I must admit I threw this together rather quickly, and only tested on two square png images, so be on the lookout for them bugs. Merry Christmas and Happy Holidays from the Poldracklab! We found Santa on the brain, methinks.
·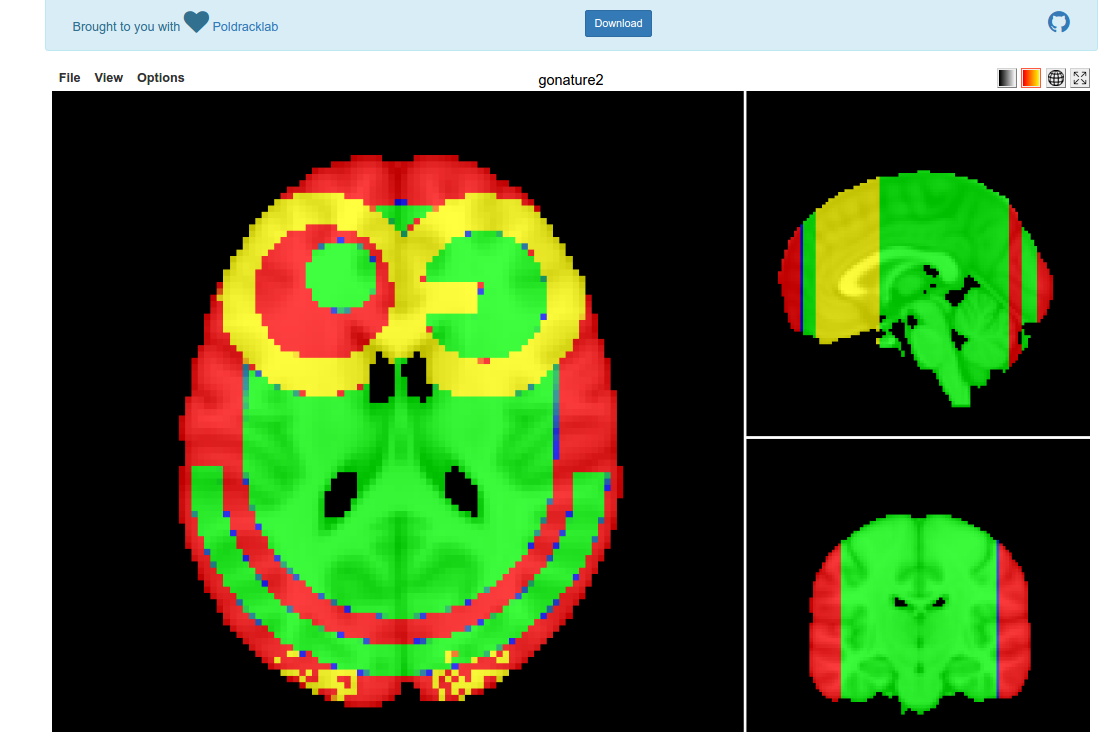
-
Behind Her Nose
It has been said that to fall in love is to see for the first time. The upturn of an eye is the deepest of blues emit from a single stringed instrument. The definition of mystery is a brief brush by the softest of skin on the inner side of the wrist. The promise of a new day is the hope that you sense in the cautious grasp of an outreached hand. These were the subtitles that called to her in metaphor and painted her life a romantic composition that brought forth beauty in the details. When others saw a point of color, she saw a tiny universe. Behind every subtle detail was a rich emotion, the full story of an intensive day that ended with the draw of a breath. If at one point it had overwhelmed her, she had learned to step into the stream of information and not fight being carried off into the current of story that surrounds the people that she cared about.
Today it was a cold, rushing flow. The gingerbread air freshener fell from the mailbox into the bushes, and she didn’t reach to pick him up. His squishy rubber body was plastered with a plastic white smile that suggested warm evenings by a fire, and family. How cold and inhumane. She sometimes wanted to be mean. She imagined it would be so satisfying to throw a nasty glance to someone that had hurt her, or turn a stone shoulder to one of the many ornery assholes of the world. She tried this every so often, and the outcome was emotional pain on her part. How squishy could she be to feel shame for being so awful to her gingerbread air freshener? Probably just as squishy as he was.
Her arms felt insanely long and her hands infinitely far away, and she seemed to remember some questions online that asked about strange body perceptions like that. The problem with making such boldly stated assertions about normality and then ascribing people with labels given some ill-defined questionnaire is that normality is an illusion, and such assertions only serve to encourage people to package themselves up and not reveal any experience or cognition that might regard them as broken, or not quite right. The irony is that the set of fundamental human qualities includes a desire to be understood, and this rests on having some ability to connect with other people. Such a simple thing can bring a soul back from sadness into finding acceptance, yet in our desire to “help” such people we discourage revelations and intimacy, and drive them deeper into emotional isolation. Nuts. The girl realized that she was standing in her doorway, again finding herself lost in her own thoughts. She was sure they would have a question about that too.
The kitchen was dark upon entering, only with a small spot of light shining on the pile of blankets where she slept on the blue tile. Everything she looked at, spoke to her in metaphor. It is usually the case that for one’s life, the color that the metaphor paints its experience, is determined by the most pressing issue in the person’s conscious or unconscious mind. The girl was instensely distracted with her an upcoming event: to make a declaration of her ultimate purpose before it was to be discovered by way of trial of error, by learning and growth. It was a backwards way to go about things, to need to sign off on a future vision and not simply declare that she wanted to continue her growth happening in the present. Thus, this was the metaphor that painted her empty kitchen that day. She did not care about a future title or role, but rather wanted to craft the perfect environment for such learning and growth, and one that would maximize those moments of brilliance when the multiple flows of information that were her constant state of thoughts came together in beautiful symphony, producing a swift and elegant efficiency that gave the feeling of the ultimate fulfillment. She was tired of being probed and tested for the things she knew, and what she did not. There were always infinite things that she would and could possibly not know. She was brilliant sometimes, and completely broken and useless in other things, and she could only promise to do her best. She wanted her best to be enough. And so she looked for this feeling in her kitchen. To be like the spoon that falls between the oven and the sink: not quite fit right to be used for cooking, but falling short of where all the other utensils were spending their time.
She wondered what it might be like to have a firm belonging in the sink, or even granted the celebrity status to get a pass into the dishwasher. In times like these, her strategy for evaluating the degree of belonging was to pretend to be someone else. The answers came easily, flooding her mind with a particularly blue and colorful river of emotional thought. “I can’t stand being with her,” thought the girl, and the statement was so assertive that she rushed out of the room to give action to its salience. It was clear that it would be easy to be overwhelmed by her intensity, a constant beat of urgency like a gust of wind just strong enough to topple one’s balance and force taking a necessary step. Her relaxed state was a breath held, over a decade ago, and forgotten. If it were to be found and rush out, with it might come particles of experience that had been swirling inside her like a dust storm for years. It’s no wonder she didn’t belong in the sink. She was less of a utensil, and more of the water rushing from the faucet.
She exited stage left from this thought, and escaped from it by closing the kitchen door behind her, collapsing onto a pile of blankets on the floor. She for some reason was adversive to wanting to purchase a bed, because it seemed like just another expensive item that would be disposed of too quickly to justify the cost, and resorted to sleeping on piles of soft things thrown on the floor in different rooms, wherever she happened to sit with her computer. She rolled over 180 degrees to face the ceiling, and threw back her arms over her head. She closed her eyes. The tiny fan that powered the entire air flow in her apartment provided a soothing noise to fight against the flashes that were the constant behind those closed eyes. It was easy to see why keeping company with others was so challenging for this explosion of a human being. Rationalization, intelligent thought, and most standard cognitive and behavioral approaches could not reason with her natural rhythm, and she found this funny. It might have seemed overwhelming to others, but was not really a big deal for her after so much life experience with it. Most insight comes from this strange kind of intense thinking, the kind that combines unexpected things in sometimes hilarious ways. She searched for some well chosen thought that would serve as a mental blankie to bring the rhythm of her mind to a different key. Sometimes she chose motivational phrases, or even Latin. Today it was two words. Just. Breathe.
It was now getting dark, and she imagined herself reduced to a dark silhouette against the setting sun from behind the blinds. It is assumed that which is right in front of us can be seen, and she found this logical and true for most tangible things. But for all that defined her in this current setting, the longest of fingers, scraggly hair and mantis arms, she came to realize that for the non-tangible, she could not be seen. And in the times like these, when her future was based on some brief evaluation by a stranger, when she wanted more than anything to be seen, it was even more unlikely. It would take an abyss of time and careful words articulated with story to properly describe whatever encompassed her spirit, and this was not feasible. It was even worse when she thought about love. It had been a painful experience, time and time again, to come to terms that despite her assumptions, the people that she loved could not distinguish her from a crowd. It is interesting how, when the seemingly different domains of life are broken into their component Legos, the fundamental human desires are equivalent. She wanted to be understood, and she wanted to be valued, and this was true across things. For this next step in her life, perhaps a different strategy was needed. To make an assertion that an external thing should see and value her in some way was not the right way to go about it.
It has been said that to fall in love is to see for the first time. It can be added to that wisdom that to be able to glow brilliantly and distinguish oneself from a crowd, one might choose to be blind. It is only when we close our eyes to the expectations of the rest of the world that we can grow beautifully, and immensely. She realized that, for this next step in her life, she did not want to try and be seen, but to just continue growing, without expectation. She wrinkled her nose at the discovery of such a lovely place in the now darkness.
· -
Reproducible Analyses: the MyConnectome Project
Reproducibility of an analysis means having total transparency about the methods, and sharing of data so that it can be replicated by other scientists. While it used to be acceptable to detail a method in a manuscript, modern technology demands that we do better than that. Today coincides with the publication of the MyConnectome Project, a multi-year endeavour by Russ Poldrack to collect longitudinal behavioral, brain imaging, and genomics data to do the first comprehensive phenotyping of a single human including imaging data. Russ came to Stanford in the Fall of 2014 when I started working with (and eventually joined) Poldracklab, at which point the data acquisition had finished, analyses were being finished up, and we were presented with the larger problem of packaging this entire thing up for someone else to run. We came up with the MyConnectome Results web interface, and completely reproducible pipeline that will be the topic for this post. Russ has written about this process, and I’d like to supplement those ideas with more detail about the development of the virtual machine itself.
What is a reproducible analysis?
From a development standpoint, we want intelligent tools that make it easy to package an entire workflow into something usable by other scientists. The easy answer to this is using a virtual machine, where one has control over the operation system and software, this is the strategy that we took, using a package called vagrant that serves as a wrapper around virtualbox. This means that it can be deployed locally on a single user’s machine, or on some cloud to be widely available. During our process of packaging the entire thing up, we had several key areas to think about:
Infrastructure
While it may seem like one cohesive thing, we are dealing with three things: the analysis code that does all the data processing, the virtual machine to deploy this code in an environment with the proper software and dependencies, and the web interface to watch over things running, and keep the user informed.
Server and Framework
A web framework is what we might call the combination of some “back-end” of things running on the server communicating with the “front-end,” or what is seen in the browser. Given substantial analyses, we can’t rely just on front-end technologies like JavaScript and HTML. The choice of a back-end was easy in this case, as most neuroimaging analysis tends to be in python, we went with a python-based framework called “Flask.” Flask is something I fell in love with, not only because it was in python, but because it gave complete freedom to make any kind of web application you could think of in a relatively short amount of time. Unlike its more controlled sibling framework, Django that has some basic standards about defining models and working with a database, Flask lets you roll your own whatever. I like to think of Django as a Mom minivan, and Flask as the Batmobile. The hardest part of deployment with Flask was realizing how hairy setting up web servers from scratch was, and worrying about security and server usage. Everything in this deployment was installed from scratch and custom set up, however I think if I did it again I would move to a container based architecture (e.g., Docker) for which there are many pre-build system components that can be put together with a tool called docker-compose like Legos to build a castle. We also figured out how to manage potentially large traffic with Elastic Load Balancing. ELB can take multiple instances of a site (in different server time zones, ideally) and can do as promised, and balance the load to the individual servers. If you’ve never done any kind of work on Amazon Web Services (AWS) before, I highly recommend it. The tools for logging, setting up alerts, permissions, and all of the things necessary to get a server up and running are very good. I’ve used Google Cloud as well, and although the console is different, it is equally powerful. There are pros and cons to each, discussion of which is outside the scope of this post.

Data
Data are the flour and eggs of the analysis cake, and if too big, are not going to fit in the pantry. When the data are too big to be packaged with the virtual machine, as was our case, option two is to provide it as an external download. However, there is still the issue that many analyses (especially involving genomic data) are optimal for cluster environments, meaning lots of computers, and lots of memory. As awesome as my Lenovo Thinkpad is, many times when I run analyses in a cluster environment I calculate out how long the same thing would take to run in serial on a single computer, and it’s something ridiculous like 8 months. Science may feel slow sometimes, but I don’t think even the turtle-iest of researchers want to step out for that long to make a sandwich. Thus, for the purposes of reproducing the analyses, in these cases it makes sense to provide some intermediate level of data. This is again the strategy that we took, and I found it amazing how many bugs could be triggered by something as simple as losing an internet connection, or a download server that is somewhat unreliable. While there is technology expanding to connect applications to clustery places, there are still too many security risks to open up an entire supercomputer to the public at large. Thus, for the time being, the best solution seems to be putting your data somewhere with backup, and reliable network connectivity.
Versions
As a developer, my greatest fear is that dependencies change, and down the line something breaks. This unfortunately happened to us (as Russ mentions in his post) when we downloaded the latest python mini computational environment (miniconda) and the update renamed the folder to “miniconda2” instead of miniconda. The entire virtual machine broke. We learned our lesson, but it begs to take notice that any reproducible workflow must take into account software and package versions, and be able to obtain them reliably.
Expect Errors
With so many different software packages, inputs, and analyses coming together, and the potential variability of the users internet connection, there is never complete certainty of a virtual machine running cleanly from start to finish. A pretty common error is that the user’s internet connection blips, and for some reason a file is not downloaded properly, or completely missing. A reproducible repo must be able to be like a ship, and take on water in some places without sinking. A good reproducible workflow must be able to break a leg, and finish the marathon.
Timing
The interface is nice in keeping the user updated about an estimated time remaining. We accomplished this by running the analyses through completiion to come up with a set of initial times associated with the generation of each output file. Since these files are generated reliably in the same order, we could generate a function to return the time associated with the index of the output file farthest along in the list. This means that if there is an error and a file is not produced, the original estimated time may be off by some, but the total time remaining will be calculated based on files that do not exist after the index of the most recently generated file. This means that it can adjust properly in the case of files missing due to error. It’s a rather simple system that can be greatly improved upon, but it seemed to work.
Communication
As the user watches a percentile completed bar increase with an estimated time remaining, different links to analyses items change from gray to green to indicate completion. The user can also look at the log tab to see outputs to the console. We took care to arrange the different kinds of analyses in the order they are presented in the paper, but the user has no insight beyond that. An ideal reproducible workflow would give the user insight to what is actually happening, not just in an output log, but in a clean iterface with descriptions and explanations of inputs and outputs. It might even include comments from the creator about parameters and analysis choices. How would this be possible? The software could read in comments from code, and the generator of the repo would be told to leave notes about what is going on in the comments. the software would need to then be able to track what lines are currently being executed in a script, and report comments appropriately. A good reprodudible workflow comes with ample, even excessive, documentation, and there is no doubt about why something is happening at any given point.
Template Interfaces
The front page is a navigation screen to link to all analyses, and it updates in real time to keep the user informed about what is completed. An interactive D3 banner across the top of the screen was the very first component I generated specifically for this interface, inspired by a static image on Russ’ original site. While custom, hard coded elements are sometimes appropriate, I much prefer to produce elements that can be customized for many different use cases. Although these elements serve no purpose other than to add a hint of creativity and fun, I think taking the time and attention for these kinds of details makes applications a little bit special, more enjoyable for the user, and thus more likely to be used.
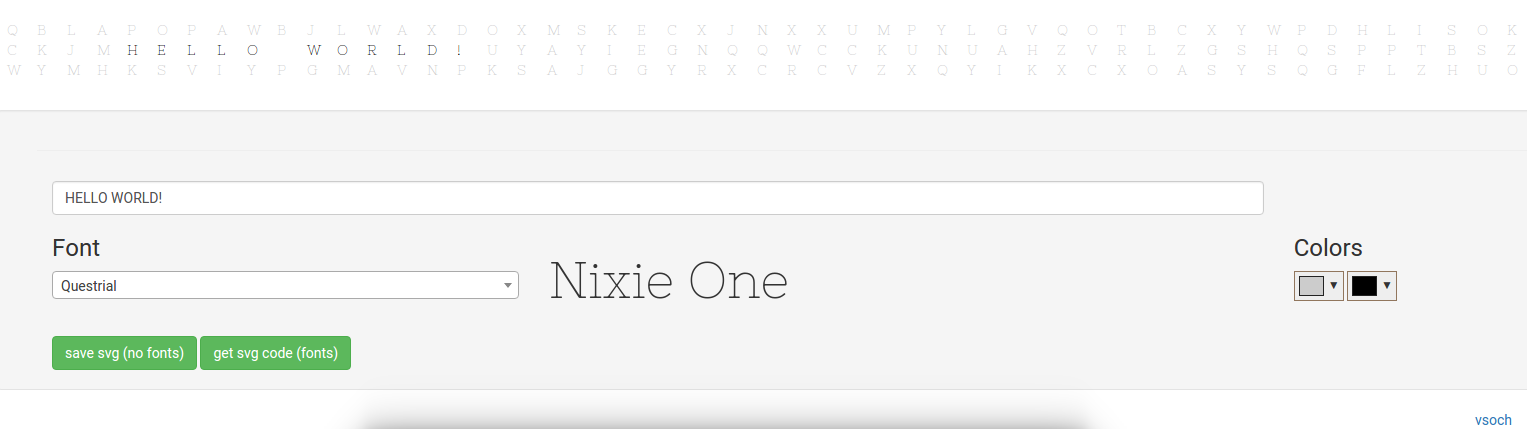
The output and error log page is a set of tabs that read in dynamically from an output text file. The funny thing about these logs is that what gets classified as “error” versus “output” is largely determined by the applications outputting the messages, and I’m not sure that I completely agree with all of these messages. I found myself needing to check both logs when searching for errors, and realizing that the developer can’t rely on the application classification to return reliable messages to the user. Some higher level entity would need to more properly catch errors and warnings, and present them in a more organized fashion than a simple dump of a text file on a screen. It’s not terrible because it worked well to debug the virtual machine during development, but it’s a bit messy.
The interactive data tables page uses the Jquery Datatables library to make nicely paginated, sortable tables of results. I fell in love with these simple tables when I first laid eyes on them during my early days of developing for NeuroVault. When you don’t know any better, the idea of having a searchable, sortable, and dynamic table seems like magic. It still does. The nice thing about science is that regardless of the high-tech visualizations and output formats, many results are arguably still presented best in a tabular format. Sometimes all we really want to do is sort based on something like a p-value. However, not everything is fit for a table. I don’t think the researcher deploying the workflow should need to have to match his or her results to the right visualization type - the larger idea here is that outputs and vIsualization of some kind of result must be sensitive to output data type. Our implementation was largely hard coded for each individual output, whether that be an ipython notebook or R Markdown rendered to HTML, a graphic, PDF, or a table. Instead of this strategy, I can envision a tool that sees an “ipynb” and knows to install a server (or point a file to render at one) and if it sees a csv or tsv file, it knows to plug it into a web template with an interactive table. In this light, we can rank the “goodness” of a data structure based on how easy it is to convert from its raw output to something interpretable in a web browser. Something like a PDF, tsv, graphic, or JSON data structure get an A+. A brain image that needs a custom viewer or a data structure that must be queried (e.g., RDF or OWL) does not fare as well, but arguably the tool deploying the analysis can be sensitive to even complex data formats. Finally, all directories should be browsable, as we accomplished with Flask-Autoindex.
Download
On the simplest level, outputs should be easy to find, and viewable for inerpretation in some fashion. It also might make sense to provide zipped versions of data outputs for the user to quickly download from the virtual machine, in the case of wanting to do something on a local computer or share the data.
Usage and Reproducibility Metrics
As all good developers do, we copy pasted some Google Analytics code into our page templates so that we could keep track of visitors and usage. However, releasing a reproducible workflow of this type that is to be run on some system with a web connection offers so much more opportunity for learning about reproducible analyses. In the case that it’s not on a virtual machine (e.g., someone just ran the myconnectome python package on their computer) we could have a final step to upload a report of results to somewhere so that we could compare across platforms. We could track usage over time, and see if there are some variables we didn’t account for to lead to variance in our results. The entire base of “meta data about the analysis” is another thing all together that must be considered.
Next steps: the Reprodudible Repo
Throughout this process, the cognition that repeatedly danced across my mind was “How do I turn this into something that can be done with the click of a button?” Could this process somehow be automatized, and can I plug it into Github? I did a fun bit of work to make a small package called visci, and it’s really just a low level python module that provides a standard for plugging some set of outputs into some template that can be rendered via continuous integration (or other platform). This seems like one of the first problems to solve to make a more intelligent tool. We would want to be able to take any workflow, hand it over to some software that can watch it run, and then have that software plug the entire thing into a virtual machine that can immediately be deployed to reproduce the analyses. I have not yet ventured into playing more with this idea, but most definitely will in the future, and look forward to the day when its standard practice to provide workflows in immediately reproducible formats.
· -
BrainArt. No, really!

There have been several cases in the last year when we’ve wanted to turn images into brains, or use images in some way to generate images. The first was for the Poldrack and Farah Nature piece on what we do and don’t know about the human brain. It came out rather splendid:

And I had some fun with this in an informal talk, along with generating a badly needed animated version to do justice to the matrix reference. The next example came with the NeuroImage cover to showcase brain image databases:

This is closer to a “true” data image because it was generated from actual brain maps, and along the lines of what I would want to make.
BrainArt
You can skip over everything and just look at the gallery, or the code. It’s under development and there are many things I am not happy with (detailed below), but it does pretty well for this early version. For example, here is “The Scream”:
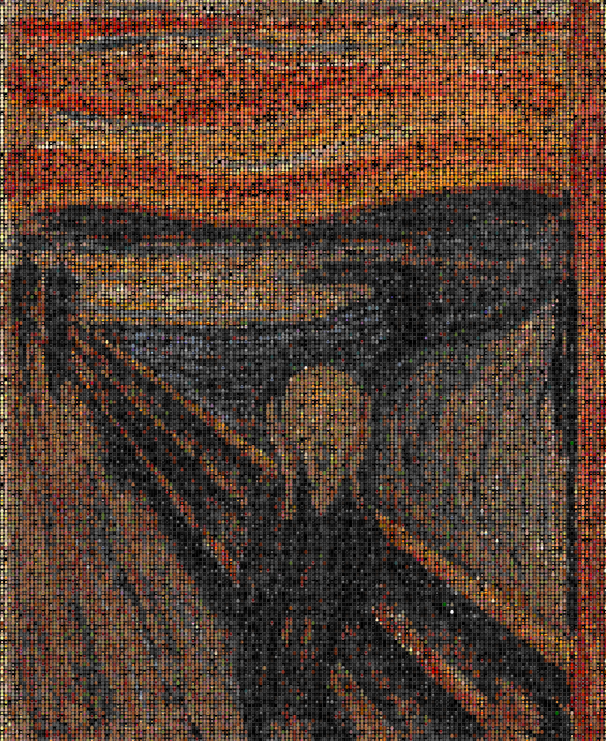
This isn’t just any static image. Let’s look a little closer…

Matter of fact, each “pixel” is a tiny brain:
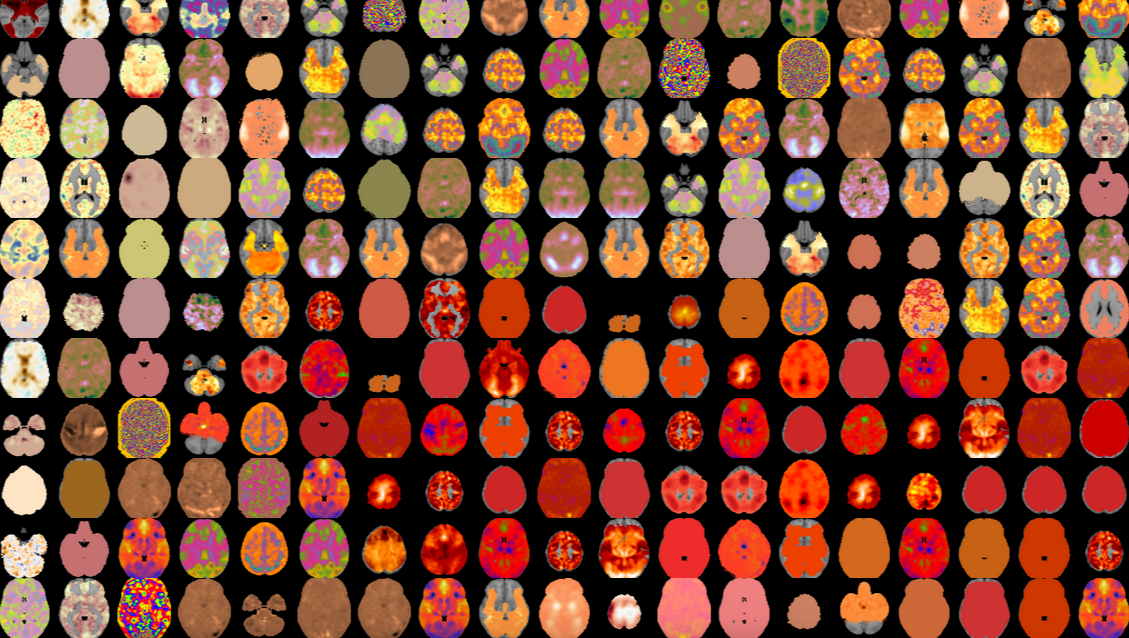
And when you see them interactively, you can click on any brain to be taken to the data from which it was generated in the NeuroVault database. BrainArt!
Limitations
The first version of this generated the image lookup tables (the “database”) from a standard set of matplotlib color maps. This means we had a lot of red, blue, green, purple, and not a lot of natural colors, or dark “boring” colors that are pretty important for images. For example, here was an original rendering of a face that clearly shows the missing colors:
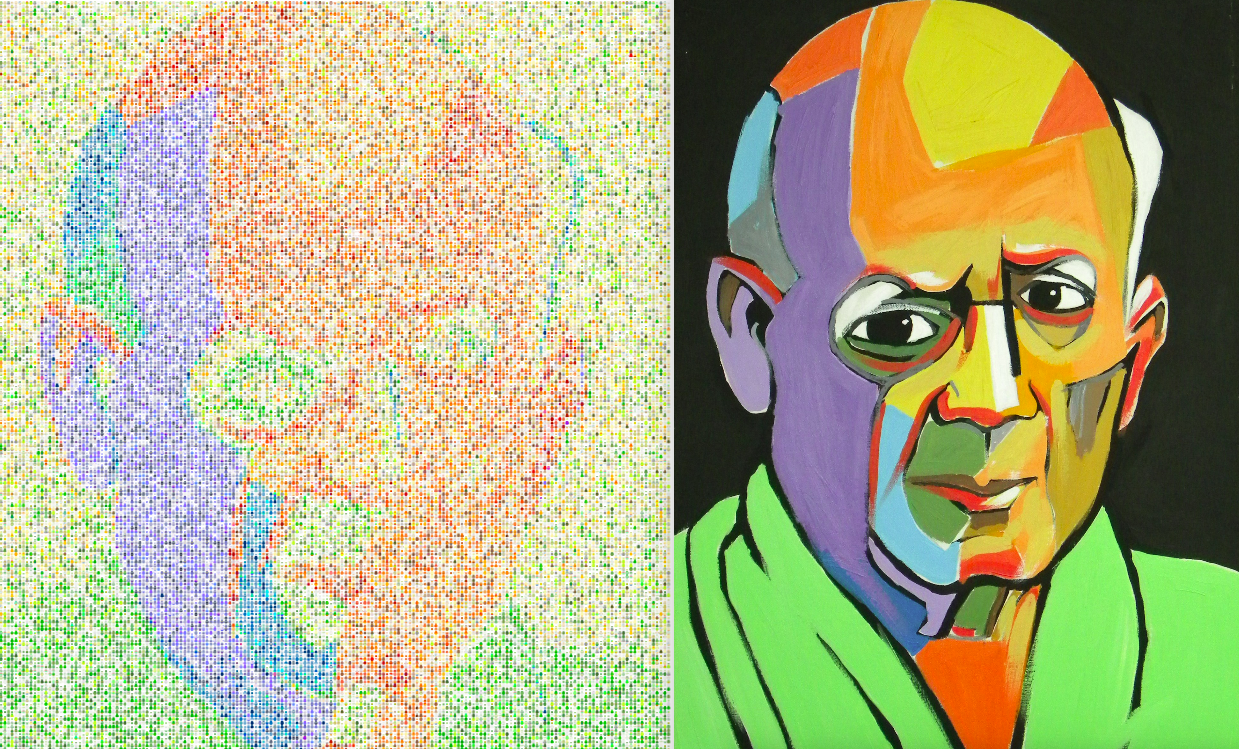
UPDATE 12/6/2015: The color tables were extended to include brainmaps of single colors, and the algorithm modified to better match to colors in the database:
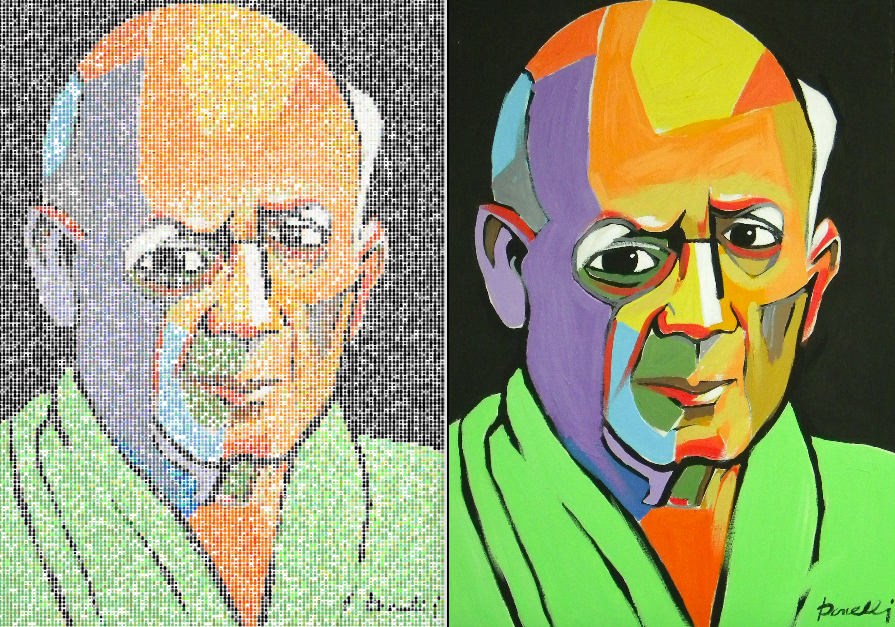
The generation could still be optimized. It’s really slow. Embarrassingly, I have for loops. The original implementation did not generate x and y to match the specific sampling rate specified by the user, and this has also been fixed.
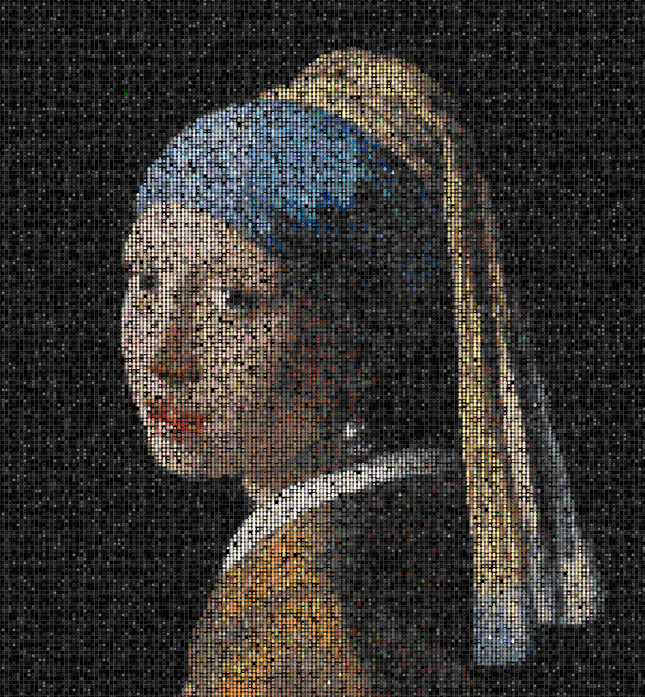
I spent an entire weekend doing this, and although I have regrets about not finishing “real” work, this is pretty awesome. I should have more common sense and not spend so much time on something no one will use except for me… oh well! It would be fantastic to have different color lookup tables, or even sagittal and/or coronal images. Feel free to contribute if you are looking for some fun! :)
How does it work?
The package works by way of generating a bunch of axial brain slices using the NeuroVault API (script). This was done by me to generate a database and lookup tables of black and white background images, and these images (served from github) are used in the function. You first install it:
pip install brainartThis will place an executable, ‘brainart’ in your system folder. Use it!
brainart --input /home/vanessa/Desktop/flower.jpg

# With an output folder specified
brainart --input /home/vanessa/Desktop/flower.jpg --output-folder /home/vanessa/Desktop
It will open in your browser, and tell you the location of the output file (in tmp), if you did not specify. Type the name of the executable without any args to see your options.
Color Lookup Tables
The default package comes with two lookup tables, which are generated from a combination of matplotlib color maps (for the brains with multiple colors) and single hex values (the single colored brains for colors not well represented in matplotlib). Currently, choice of a color lookup table just means choosing a black or white background, and in the future could be extended to color schemes or different brain orientations. The way to specify this:
brainart --input /home/vanessa/Desktop/flower.jpg --color-lookup blackSelection Value N
By default, the algorithm randomly selects from the top N sorted images with color value similar to the pixel in your image. For those interested, it just takes the minimum of the sorted sums of absolute value of the differences (I believe this is a Manhattan Distance). There is a tradeoff in this “N” value - larger values of N mean more variation in both color and brain images, which makes the image more interesting, but may not match the color as well. You can adjust this value:
brainart --input /home/vanessa/Desktop/flower.jpg --N 100Adding more brain renderings per color would allow for specifying a larger N and giving variation in brains without deviating from the correct color, but then the database would be generally larger, and increase the computation time. The obvious fix is to streamline the computation and add more images, but I’m pretty happy with it for now and don’t see this as an urgent need.
Sampling Rate
You can also modify the sampling rate to produce smaller images. The default is every 15 pixels, which seems to generally produce a good result. Take a look in the gallery at “girl with pearl” huge vs. the other versions to get a feel for what I mean. To change this:
brainart --input /home/vanessa/Desktop/flower.jpg --sample 100Contribute!
The gallery is the index file hosted on the github pages for this repo. See instructions for submitting something to the gallery. While I don’t have a server to host generation of these images dynamically in the browser, something like this could easily be integrated into NeuroVault for users to create art from their brainmaps, but methinks nobody would want this except for me :)
·
-
Brain Matrix
I wanted to make a visualization to liken the cognitive concepts in the cognitive atlas to The Matrix, and so I made the brain matrix without branding. Canvas was the proper choice for this fun project in that I needed to render the entire visualization quickly and dynamically, and while a complete review of the code is not needed, I want to discuss two particular challenges: Rendering an svg element into d3
The traditional strategy of adding a shape to a visualization, meaning appending a data object to it, looks something like this:
svg.selectAll("circle")
    .data(data)
    .enter()
    .append("svg:circle")
    .attr("cy",function(d,i){ return 30*d.Y })
    .attr("cx",function(d,i){ return 30*d.X })
    .attr("r", 10)
    .attr("fill","yellow")
    .attr("stroke-width",10)
You could then get fancy, and instead append an image:
svg.selectAll("svg:image")
    .data(data)
    .enter()
    .append("svg:image")
    .attr("y",function(d,i){ return 30*d.Y })
    .attr("x",function(d,i){ return 30*d.X })
    .attr('width', 20)
    .attr('height', 24)
    .attr("xlink:href","path/to/image.png")
The issue, of course, with the above is that you can’t do anything dynamic with an image, beyond maybe adding click or mouse-over functions, or changing basic styling. I wanted to append lots of tiny pictures of brains, and dynamically change the fill, and svg was needed for that. What to do?
1. Create your svg
I created my tiny brain in Inkscape, and made sure that the entire thing was represented by one path. I also simplified the path as much as possible, since I would be adding it just under 900 times to the page, and didn’t want to explode the browser. I then added it directly into my HTML. How? An SVG image is just a text file, so open it up in text editor, and copy-paste away, Merrill! Note that I didn’t bother to hide it, however you could easily do that by giving it class of “hidden” or setting the visibility of the div to “none.”
2. Give the path an id
We want to be able to “grab” the path, and so it needs an id. Here is the id, I called it “brainpath”. Yes, my creativity in the wee hours of the morning when making this seems like a great idea is, lacking. :)
3. Insert the paths
Instead of appending a “circle” or an “svg:image,” we want a “path”. Also note that the link for the image (“svg:a”) is appended first, so it will be parent to the image (and thus work).
svg.selectAll("path")
    .data(data)
    .enter()
    .append("svg:a")
        .attr("xlink:href", function(d){return "http://www.cognitiveatlas.org/term/id/" + d.id;})
    ...
I then chose to add a group (“svg:g”), and this is likely unnecessary, but I wanted to attribute the mouse over functions (what are called the “tips”) to the group.
    ...
    .append("svg:g")
    .on('mouseout.tip', tip.hide)
    .on('mouseover.tip', tip.show)
    ...
Now, we append the path! Since we need to get the X and Y coordinate from the input data, this is going to be a function. Here is what we do. We first need to “grab” the path that we embedded in the svg, and note that I am using JQuery to do this:
var pathy = $("#brainpath").attr("d")What we are actually doing is grabbing just the data element, which is called d. It’s a string of numbers separated by spaces.
m 50,60 c -1.146148,-0.32219 -2.480447,-0.78184 -2.982912,-1.96751 ...When I first did this, I just returned the data element, and all 810 of my objects rendered in the same spot. I then looked for some X and Y coordinate in the path element, but didn’t find one! And then I realized, the coordinate is part of the data:
m 50,60...Those first two numbers after the m! That is the coordinate! So we need to change it. I did this by splitting the data string by an empty space
var pathy = $("#brainpath").attr("d").split(" ")getting rid of the old coordinate, and replacing it with the X and Y from my data:
pathy[1] = 50*d.Y + "," + 60*d.X;and then returning it, making sure to again join the list (Array) into a single string. The entire last section looks like this:
    ...
    .append("svg:path")
    .attr("d",function(d){
       var pathy = $("#brainpath").attr("d").split(" ")
       pathy[1] = 50*d.Y + "," + 60*d.X;
       return pathy.join(" ")
     })
    .attr("width",15)
    .attr("height",15)
and the entire thing comes together to be this!
svg.selectAll("path")
    .data(data)
    .enter()
    .append("svg:a")
        .attr("xlink:href", function(d){return "http://www.cognitiveatlas.org/term/id/" + d.id;})
    .append("svg:g")
    .on('mouseout.tip', tip.hide)
    .on('mouseover.tip', tip.show)
    .append("svg:path")
    .attr("d",function(d){
       var pathy = $("#brainpath").attr("d").split(" ")
       pathy[1] = 50*d.Y + "," + 60*d.X;
       return pathy.join(" ")
     })
    .attr("width",15)
    .attr("height",15)
Embedding an image into the canvas
Finally, for the cognitive atlas version I wanted to embed the logo, somewhere. When I added it to the page as an image, and adjusted the div to have a higher z-index, an absolute position, and then the left and top coordinates set to where I wanted the graphic to display, it showed up outside of the canvas. I then realized that I needed to embed the graphic directly into the canvas, and have it drawn each time as well. To do this, first I made the graphic an image object:
var background = new Image();
background.src = "data/ca.png";
Then in my draw function, I added a line to draw the image,
ctx.drawImagewhere I wanted it. The first argument is the image variable (background), the second and third are the page coordinates, and the last two are the width and height:var draw = function () { ctx.fillStyle='rgba(0,0,0,.05)'; ctx.fillRect(0,0,width,height); var color = cacolors[Math.floor(Math.random() * cacolors.length)]; ctx.fillStyle=color; ctx.font = '10pt Georgia'; ctx.drawImage(background,1200,150,200,70); var randomConcept = concepts[Math.floor(Math.random() * concepts.length)]; yPositions.map(functioPretty neat! The rest is pretty straight forward, and you can look at the code to see. I think that d3 is great, and that it could be a lot more powerful manipulating custom svg graphics over standard circles and squares. However, it still has challenges when you want to render more than a couple thousand points in the browser. Anyway, this is largely useless, but I think it’s beautiful. Check it out, in the cognitive atlas and blue brain versions.
· -
Nifti Drop
The biggest challenge with developing tools for neuroimaging researchers is the sheer size of the data. A brain is like a mountain. We’ve figured out how to capture it with neuroimaging, and then store the image that we capture in a nifti little file format (that happens to be called nifti). But what happens when we want to share or manipulate our mountains in that trendy little place called the internet? That’s really hard. We rely on big servers to put the files first, and then do stuff. This is an OK strategy when you have brain images that are big and important (e.g., to go with a manuscript), but it’s still not standard practice to use a web interface for smaller things.
Drag and Drop Nifti
I want to be able to do the smaller stuff in my web-browser. It’s amazing how many posts I see on different neuroimaging lists about doing basic operations with headers or the data, and visualization is so low priority that nobody gives it the time of day. One of my favorite things to do is develop web-based visualizations. Most of my work relies on some python backend to do stuff first, and then render with web-stuffs. I also tried making a small app to show local images in the browser, or as a default directory view. But this isn’t good enough. I realized some time ago that these tools are only going to be useful if they are drag and drop. I want to be able to load, view header details, visualize in a million cool ways, and export different manipulations of my data without needing to clone a github repo, log in anywhere, or do anything beyond dragging a file over a box. So this weekend, I started some basic learning to figure out how to do that. This is the start of Nifti-drop:
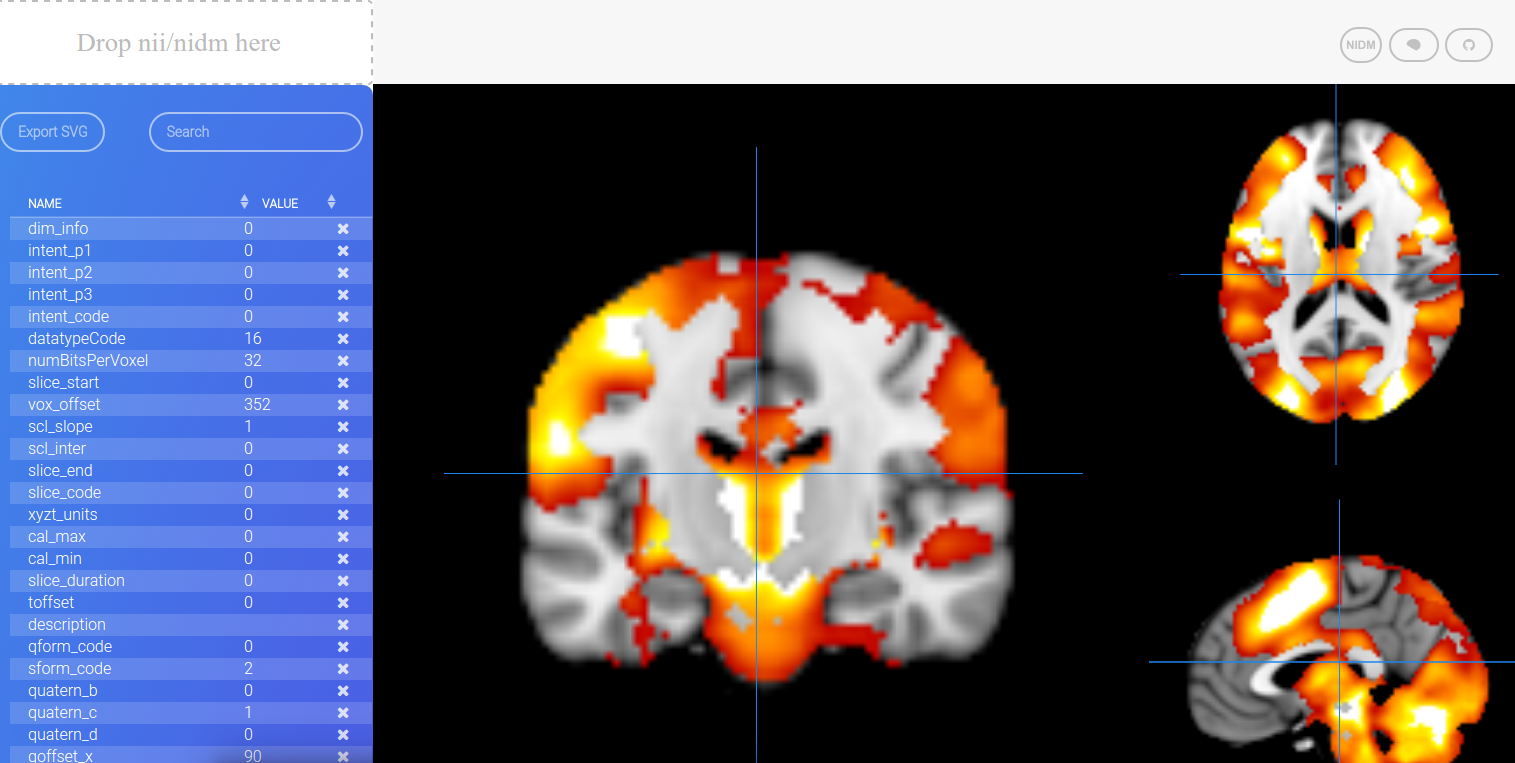 #DEMO
#DEMOIt took me an entire day to learn about the FileReader, and implement it to read a nifti file. Then I realized that most of those files are compressed, and it took me another day to get that working. My learning resources are an nifti-js (npm), the nifti standard, FileReader, and papaya. It is 100% static, as it has to be, being hosted on github pages!
What I want to add
Right now it just displays header data alongside an embarrassingly hideous histogram. I am planning to integrate the following:
Papaya Viewer: is pretty standard these days, and my favorite javascript viewer, although the code-base is very complicated, and I can barely get my head around it.
NIDM Export: meaning that you can upload some contrast image, select your contrast from the Cognitive Atlas, and export a data object that captures those things.
Visualization: Beyond a basic viewer, I am excited about being able to integrate different visuaization functions into an interface like this, so you can essentially drop a map, click a button, get a plot, and download it.
NeuroVault: is near and dear to my heart, and this is the proper place to store statistical brain maps for longevity, sharing, publication, etc. An interface with some kind of nifti-drop functionality could clearly integrate with something like NeuroVault or NeuroSynth
Feedback
Please post feedback as comments, or even better, as github issues so I will see them the next time I jump into a work session.
· -
For Brother and Jane
Before the light of this evening
Into a memory does wane
I would like to share a sentiment
for Brother and JaneThe nostalgia within us all
on this fifth of September
is not entirely in this moment
but in the things we rememberWe step in and out of ourselves
Like an old pair of shoes
And the biggest insight to life may be
that our happiness we do so choseWhen Brother was small
A curly haired Matthew
Not much taller than a hip
and I called him CashewWith imagination we built
tiny ships out of paper
he had a slight head tilt
he was rice and cheese caperWe lived in our heads
and that made adolesence hard
Brother receded into himself
put up an emotional guardIt was ten years later
during college at UMASS
when he grew into himself
and I realized this time had passedAnd then he went to Spain
and interpret how you will this sign
Brother became a debonnaire
and developed a taste for red wineAnd during his time in med school
a memory not mine but true
Brother laid eyes on the lovely Jane
and thought, “I choose you.”And such happiness in my heart
to see this love unfold
such joy in my family
for this story to be toldAnd it is not something to fear
to grow up and old
because destiny is not decided
But rather foretoldI love you so much,
·
From fire start to fading embre
Remember, remember, the fifth of September -
Reproducibility: Science and Art
I was thinking about the recent “Reproducibility Project” and how it humbly revealed that science is hard, and we really aren’t certain about much at all, let alone having confidence in a single result. Then I started to wonder, are there other domains that, one might say, “got this reproducibility thing down, pat?” The answer, of course, is yes. Now, I’m extremely skeptical of this domain, but the first one that comes to mind is art. Can we learn any lessons for science from art? The metaphor is clear: It was technology that gave power to reproducible art. We can imagine a single statistical result as an effort to capture a scene. A master painter, if for a second you might superficially say his effort was to reproduce such a scene, went out of work with the advent of the photograph. A photographer that develops film was replaced by the printer, and then digital photography exploded that the quantity to insurmountable digits. This is not to say that we should change our expectations for the quality of the photograph. Any kind of result is still valued based on the statistical decisions and experimental design, just as a single picture can be valued based on the quality of the production medium and decisions for the layout. However, the key difference is figuring out how to produce such a result with the quality that we desire en-masse. And just like the photograph, the answer is in the technology. If we want reproducible science, we need better infrastructure, and tools, whether that comes down to the processing of the data or dissemination of the results. If we want reproducibility the responsibility cannot be in the hands of a single artist, or a single scientist. We must do better than that, or things will largely stay the same: slow progress and limited learning. I cannot say that it is not valuable to ask good biological questions, but this kind of thing is what makes me much more passionate about building tools than pondering such questions.
· -
Different
It was only when she was surrounded by others that she felt terribly alone. The floor was speckled with what must have been a mix of spilled alcohol combined with hot wing sauce taking a ride from table to bathroom on exhausted shoes. The standing tables with flowers were lovely, but out of place. The sitting tables, pushed together, were shaking and rumbling against the slam of finished glasses, orders being wrong or just plain forgotten, and garrulous laughter that, much of the time, might have been forced from a cohort of unwilling alveoli. And sitting at a table in the middle of it all, the tired girl was distracted by her inability to find the right place to put her feet. She was surrounded by people that she cared so deeply about, but somehow could not reach them through the blockade of noise. Her lovely new backpack, clean and black as a velveteen raven, waited patiently by the base of the chair, and she held her breath each time the rattled waitress scurried over with an ever-tilting, tiny striped tray with overfilled, dripping beers and martini glasses. She imagined the tray falling over, likely a regular occurrence for the pony-tailed waitress bee, and a catastrophic outcome for the girl’s collection of things that she carried with her.
Only when we leave the lovely place of our passions do we find things that we do not want to find. The girl lived primarily in a beautiful world inside of her head. In this place, she found happiness. She could someday master her domain, lead an army, inspire a heart, and it didn’t matter if that domain, army, or heart lived entirely within herself. From a confusing, unidentifiable source she derived focus and drive toward solving tiny challenges, and solving these tiny challenges gave her meaning and emotional triumph. It was not something that needed attention or validation from any external source. She didn’t care what she might be called, the amounts it would lead her to, or the next calendar event she was supposed to look forward to. If we might be given a running start to imagine the ideal version of ourselves at some future time, it’s only a distraction from the reality that we are existing and full in the present. For the girl, this fullness was intoxicating. She was in a constant competition with herself, like a game of hide and seek where you are searching for the next version of your dreams across time. This intensity at various times in her life had been overwhelming, leading her to run across mountains, bike thousands of miles, and continue a search for solace in some yet-undiscovered alcove in her mind. But with much life experience comes knowing that the self is less an actual thing and more of a decision. The fun at the wedding party is not the shoes you put on but the feet that you put into them. The turkeys can only get you down if you offer yourself as doormat to their turkey feet. Her overwhelming intensity had matured and grown into an undying source of inspiration and happiness.
But this internal fire, like any source of warmth, was subject to the temperature around it. The external stimuli was too much for any of her tricks, and although she hadn’t a clue what everyone was erupting about, the force of it brought her to respond with an equivalent forceful laugh, a response that was an effort to fight a current by swimming in the same direction. All of her efforts to sneak off into dreaming about building elegant systems and tools were overpowered by such noise. She imagined that she might pull from her pocket a small packet of dust, and throw it into the air to cause a melodic pause, and tiptoe away to her bike parked outside. Was he still safely secured to the sign post? Do bikes get lonely? She imagined a world where bikes too would meet up to socialize after work, and decided that they would definitely go to pick up roller skates at a roller rink. In the world of transportation, love and companionship are shared by the common trait of having wheels.
Her fantasy was interrupted at a question directed toward her. Why did she have to make a claim about things that she would want to do tomorrow if she loved the things that she did today? The arbitrage of external inputs made her feel washed away and empty. It was situations like these, being completely surrounded by people, when she felt completely isolated. It was times like these when loneliness grew in her heart because she suddenly felt out of place. It was moments as blurred and hazy as this evening hour when she realized that one of the things is not like the others, and she was not an others. And so she endured until she was certain that there could possibly be no more plates of tiny meat on sticks arriving at the table, and then she made her escape. It was with directed energy that she flowed through the back of the restaurant, as if guided by an invisible current from a deus ex machina. She felt relief and empowerment unlocking her bike, and feeling the force of the tires restored her to the lovely state of being in her own thoughts. She had felt this a thousand times before, and yet she still kept trying. It had come to her when she was a little girl, when she walked home in the setting sun after running practice in high school, and when she looked across the desolation of campus after the last day of classes during University. It’s common and normal to be different, but she had yet to meet another soul that she imagined felt as she did.
But something today was different. The growing loneliness, a gently spreading gray, was leaked into by a soft purple when she imagined him in her minds eye. It had been days since they walked together, and she wanted nothing more than to talk to him. The spending of a parcel of extra time without him felt like an opportunity cost, like choosing to not have ice cream when you really had wanted to try the coconut. He had a kindness, naivete, and quiet intellect that made him incredibly handsome and endearing, and she was sure that he didn’t even know it. She had hugged him twice, even mustered up the courage to look him in the eye, and it made her feel comforted, safe, and understood. She wasn’t even sure that her immediate family, let alone the rest of the world, understood what it was like inside her head, but she was convinced that he might. It was as if she had traveled thousands of miles, for decades, and found, for the first time, someone that brought color into the grays of being surrounded by social loneliness. People she had loved, in painful obvious and unrequited secret, had never loved her back, and yet her heart always seemed to return to an idealistic, childish hope to find such understanding. And as she pedaled home, across the traffic, lights, and scurry of downtown, her mind erupted in beautiful, colorful memory. If a moment in time can be like the beginning of a universe, the expansion had just begun. Little did she know that she was now on a path to separate herself, one tiny eon at a time, from the last moment she would ever feel alone.
· -
The Sound of Silence
There once was a small town in the province of Heschl, where there lived a young woman, Silence. At dinner parties there was never an empty plate, for parts of speech she brought eight. She carried with her a fountain pen, and painted the taverns and shops with a poetic zen. Her suffixes, whether a -lit or -ation, completed the prefixes that rushed out of the mouths of the people with confident start and lacking end. The tiny houses, one or two story, were ever so carefully framed with her guidance. If she tried to mediate a dilemma it was common knowledge to let her, because with every pro she brought a con, and for every right, she could present with a wrong. Her words were beautiful to see, her similie like a hot, body warming tea.
Then one day, silence fell in love. He was so empty of meaning that Silence was drawn to smother him with everything that she might have. His jacket was the most beautiful, darkest of blues that she imagined it caused the purples, indigos, and violets that shared near on the rainbow to faint. His eyes read of nothing but were stained with a story of a million lifetimes. Somewhere in his jacket she imagined there to be a tiny pocket-watch where he kept all of time at a standstill. He was undefined, needing, and lost. His name was Sadness.
To his cold lips she lifted a warm cup of story, and hoped that it might flow life and joy into his tired veins. He tasted the broth, and pushed the cup away. She aired his dark cape in a lovely fragrence of pun and wildflowers, and he returned a cold, empty stare. Around his shoulders she put the blanket of a sonnet, her most powerful words paired in twos and threes, and his reponse was a mistrusting, flash of grimace, of seize.
Sadness’ first response was with neutral melancholy, but soon he scratched away all formality and started to bear the turmoil he created inside himself. Silence wanted so badly to give him her words, but he ridiculed her. He brought out the demons that so haunted him and released the pain that he felt into her open heart. He captured her song with his fist, squeezed it until it trickled no more, and cast it across the room where it hit the wall, and crumpled to the floor. In her decades of life, the only thing she could bring to a fight was her word, and without her word she was as vulnerable as the empty lines that were missing it. Silence had tried, so hard, but Sadness could not bear to let her words give him sustenance.
She had nothing more to give him. Her words had failed her. Her eyes, reflecting the being across from her, were stained with Sadness. There was never a time when no gesture went without the beautiful song of Silence. There was never a moment when human thought or desire was left without a way to express it. This moment marked a change in the short, but ever-present human history. Silence had fallen in love, and fallen she would remain. The entire village too, was at a loss for words, and they would never recover from this new inability to not effortlessly express themselves.
And now, Silence put down her pen, and for the first time, parted her lips, and there was truly nothing. The laughter of beauty receded into the tapestries, and the echos of hope hid behind the mountains. For the first time, the world heard the sound of silence, and it was heartbreaking.
· -
The Mountain
He had wanted it to be her. The fantasy had been imagined so many times, repeated indefinitely in his head, that the absence of the defining moment was as unacceptable as ripping a page out of a book. The back of his neck radiated heat, calling forth a cool, wet cloth that might provide temporary relief to his discomfort. They say that drinking hot liquid like tea actually serves to cool the body, but the thought of introducing more heat into the system seemed illogical and unsafe to him in that moment.
For all his successes, it was not enough. As a man, he was defined by his cleverness, ample responses when thinking on his feet, the momentary flash in his eye before responding to a challenge, and the mastery that was hidden in the s’s that should have been z’s in his words. It was not enough because the true strength of a man is not in the outside of a perception, but the inner workings, and coming to terms with the self without need for deception.
His heart felt like a tea bag immersed in a stew of hot water. It was filled with aromatic leaves and spice, and one would think they would escape when submersed in the first and last hot liquid that they would ever touch. But the translucent, slightly waxy white bag was a terrible lie. It puffed up like a white pressed shirt filled with air, giving subtle hint to the shadow and shape of the leaves inside, but barely a worthy taste or strength of the hidden potpourri could escape. And so it was submersed a second, a third, and another time, each instance a meek effort to release the pungent smelling spice. But too long in the bath only serves to wrinkle fingertips and diminishes the ability of the soapy water to bubble: the tea bag loses its strength and fades away. Or so we think, because no one really knows what happens to the true composition of the contents inside. But he knew exactly. The same was true of his heart. An external hope, an openness to expressing vulnerability and aching for the chance to send it off like a raft down a creek, and then following through, only served to build up more apprehension should that raft submerge and sink. The concentration of the outside steam was in complete, counter-intuitive opposition to the increase in intensity of that which remained inside. He would immerse himself entirely in just one more experience, a chance to finally give in completely to the surroundings, but each time the water was drank and he left slightly lesser than before.
And so in times like these, he reached for something else in his pack, something that, rationally should counter such a herbal heat. He shouldn’t have drank that soda, but it’s bite was so sharp, so quick and intensely satisfying that it sent his teeth into a painful overdrive that shot up to the roots and climaxed into the most awful and wonderful of cold headaches. It was a shot that gave him a momentary high, and it brought him back to the memory he so yearned for in his time of thirst.
The mountain sky was blue, and then pink and red and purple, a distant painting to emphasize the impressive beast that it framed. He had touched that mountain in close detail. In the bitter cool morning the rock was unforgiving to his pleas and made each reach a calculated and unnerving risk. As it warmed in the rising sun, it promised him nothing but shadows, and greatness always one more peak away, if his bleeding hands could stand it and there was just enough powder left to cover his fingers like a powdered doughnut. At the crest of the day he made the final push, and then the mountain gave him everything, its most fantastic and shattering vulnerabilities all revealed at the sudden realization that there was no more vertical place to be reached and if there was a heaven this was truly it. Surrounding the thin and life-giving air was nothing but space and infinite time, and that is where he lost himself, and found an addictive warmth of awe, humility, and love. It was when the murkiness and stress of everyday life was lifted, to reveal his deepest thoughts and sequestered desires, when he tasted hints of meaning and purpose. And that’s when he saw her. Those dark, compassionate eyes rendered in his soul. She was not bold enough to speak outwardly above the noise of the group, but her affection and concern for him was stronger than the loudest of voices. She gave him hope, filled him with sustenance, and a beautiful sonata that echoed in the crevices of the mountain. Her deepest insecurities, were beautiful to him. His most humanizing imperfections, she eroded away with a single wave of her joyful smile. In the portrait of that mountain was ingrained her presence, and he climbed it relentlessly in his mind looking for her likeness.
The summit was beautiful, but missing the realization of that which he longed for so deeply. He came back to the harsh reality of the evening train. The back of his neck was so hot. How could he be overheating in such a cool air? The car door opened, and he lifted inside his bike, a faithful companion yet disappointingly void in terms of conversation, and never expressing preference for Miso soup or dumplings. An ocean of tired faces lifted their bikes into the same car, and strangers equally monitored the stream looking for friend or companion. It was a long ride, and at every turn of a head with straight, dark hair, he hoped to see those soulful eyes peering out from a head caged in a bike helmet. It was never her. He didn’t ache for yet another conversation about numbers or missing method, but just a companion to render the space around him safe and comforting, to combat the awful taste of too many people marinating in such a tiny space. He certainly did not need her to define him, or to give him focus to his work, but he didn’t want to have to be so outwardly strong, and so caged all of the time. From the mountain to the setting suns that passed by the window day after day, his heart was filled with so much beauty that if he could not share it, he would surely explode.
But in the dawn of the moonlight this evening, he realized that he found his own heart in the mountain. It’s majestic grace, character, and quiet wisdom had and would continue to give him peace. It was an unconditional love; it would not turn him away, it would give him air to counter the things that took it away from him. For so long he had selfishly looked for himself on those cliffs without giving back to the beast that guided his heart. An artist of movement and position, he had painted his story into the ledges time and time again, providing another layer to complement such a majestic portrait.
And so, he brought her to the mountain, a gift to further complement this majestic portrait. The reds, pinks, and blues gave backdrop to not a single, but a group silhouette against the setting sun enveloping the lake. Warmed by a small fire and the sound of chopsticks, the mountain gazed at the creation that it had inspired. The momentary loneliness that comes with the dusk was returned to content, akin to the feeling of companionship that comes with reveling at existing in the same space as someone that you love. It is sometimes lonely to be a mountain, because it is expected to give itself to those that sacrifice themselves. But when the bravest of climbers see its true vulnerability, they bring their experiences to share with it. And the tea, shared by all, was fragrant, full bodied, and finally realized.
· -
The Ultimate
Now since 17 days has come to bear,
·
let me tell you about this ingrown hair.
Upon first introduction, when all was new to me
he was introduced as my new friend JP.
Between him and I it is hard to tell
But on this distinction, I’ve come to dwell.
He emerges from a labyrinth that I cannot see
intermixing and twisty, elaborate like a tree
Unassuming but strange, he pokes out of his hole
Not to be mistaken for freckle or mole.
From the outside glance I would never know
where this JP does boldly go.
Submerging from the surface, behind my ear
wrapping through the cheek, blue and clear.
He then dives down, running out of space
into the depths of that soft necky place.
Where he ends I have yet to feel
His girth and length, I’m going to reel.
He was supposed to leave after 7 days time
but he refused, his home far too sublime.
And after this time had come to pass
JP has a little bit of attitude, of sass.
He drools more on the pillow than I’ve ever done
He can’t talk much in public, so he leaks a ton.
He spits out presents of things I can’t ID
So many gifts, without a charge or fee!
His fashion sense, questionable at best,
a white mumu to complement my black vest.
I have often wished to yank out this fool,
I could sure do without following his rule.
But reminded am I, the reason he is here
Is to give me care, in a time of fear.
And so he continues, a batman in a private lair
the diabolical, the most ultimate, ingrown hair. -
Flask Banner Image Application
Two interesting circumstances combined today, and the result was a fun project that, like most things that I produce, is entirely useless. However, it is a Saturday, which means that I can fill my time with such projects that, albeit being useless, are awesomely fulfilling to make. The two circumstances were 1) I really like making Flask applications, and 2) I am highly allergic to pushing around pixels in Illustrator/Inkscape.
And what happened?
I found myself needing to make a banner graphic. It was a simple style – a text string of my choice hidden inside randomly generated letters. I then realized, to my despair, that this would require at least 10 minutes of using Inkscape. Nothing could be so painful. My creative brain then started up its usual humming. If I could make this svg dynamically, I could add beautiful animations, or minimally, some kind of interactivity to it. I could even make a tool so that, the next time I needed one, I wouldn’t have to start from nothing. This resulted in the “banner-maker.” A few points:
Fonts: come by way of Google Fonts. There are over 600 in the database, and I randomly selected just under 200. All of these fonts are added with a single css link.
Input Data: includes hidden letters inside of a randomly generated list, x and y coordinates, as well as two colors. I wrote a standalone function to generate such data.
Application: is of course flask! We parse the user input from the page, and update the url, which re-renders the page with a new graphic.
SVG: is of course produced with simple text nodes a la D3.
The biggest issue is that my button to save the svg image does not render the Google Fonts, and because of this I added a box for the user to copy paste the svg code for his or her application. It’s not perfect, but my original intention was not to generate the tool, but the python code so that I can build a cool interface with more interactive functionality integrated into this banner. It was fun to make, and now I’m ready for a long walk home and a good dinner.
· -
Freckles
Her landlord thought she was nuts. Or minimally, just super annoying. Her fear of complaining was reaffirmed by the small white note that appeared in the mailbox the very same day of the complaint. It was a polite notification that the rent would be increasing by $100 in the next month. She had lived there for two years, and never anything like this, until this single day when she had to say something. But how could she not? It was a feat of strength, and a struggle, every single time the key went into lock. It was a game of probability. There was a 0.3 probability that it would not turn the bolt to the left. Then another 0.3 that it wouldn’t come out, or even turn at all. That under 10% chance occurrence happened on the morning of the complaint, or better stated, the morning of the meek text message that started it all. This time, however, the sheer force of exerting her entire 121 pounds on the key made the inside of her inner knuckles bleed. Are complaints justified if they draw blood? The note was followed by silence. Sometimes great mistakes can be undone if you pretend they never happened at all. But it’s called “wishful thinking” for a reason. The silence after a storm is not convincing that the storm never happened at all, but rather, that damage caused and a call for reflection can cohabitate in the same moment. Such combination is a recipe for contemplation and forgiveness. But she worried in this case it was an eerie foreshadowing of proactive action and manipulation.
Her landlord was on, she thought, a strategic mission to be rid of her. Did these things work like most relationships, in that one party gets bored and wants to change things up? The landlord had asked twice in the afternoon when she visited about how many years were left in the PhD. The second asking was rationalized with an abrasive comment about being short of hearing, but it was a passive aggressive statement that cut into her, sharp and suffocating as she imagined it would be for a sumo wrestler modeling an elastic bikini. Actually, about half of what the landlord said, the girl didn’t understand at all. She was a petite Asian woman, fiery and commanding despite her small stature, usually dressed in a flowered shirt that was a cross between a nurse’s scrub and a sweet smelling pajama. Her eyes were beady, so that there was no possible way to look deeply into them and infer if understanding or empathy was instilled. She had clearly worked hard her entire life, made no excuses, and demanded respect. But these qualities also made her extremely hard to read, meaning that trying to sift through her actions to uncover true intentions was about as easy as bringing a strainer to sand and maple syrup. A pancake of worry started to roll up in her mind. Was she not the ideal tenant she imagined herself to be? In the middle of the night she had taken to blending ice drinks to ward away the dank heat. She did not pay for utilities, but every so often turned on a fan hidden in the window to flush the hot air out of the apartment. She responded to a gas leak by not asking for replacement pipes, but by unplugging the stove and using it as a glorified laundry organizer. Finally, she regularly placed recyclables in the trash bin, mostly out of sheer laziness and a “collective action failure” frame of mind that her single instances of defaulting on recycling wouldn’t make any difference toward planetary well being. Recycling wouldn’t have been so terrifying if the bins and dumpster didn’t evoke the backyard scene from the 1990’s movie “The Sandlot,” the night-time smoothies wouldn’t be necessary if she wasn’t so darn thirsty all the time, and the fan wouldn’t be needed if she wasn’t so highly allergic to every airborne pollen, mold, and dust mite. If only her immune system had more strength than a lethargic cat. Perhaps her landlord had picked up on these details and the evidence was now too far stacked against her favor to pull herself out of the hole that she had slowly dug with a plastic spoon.
There was a sudden knock at the door, and she responded immediately. It was her neighbor across the street, an older Indian man, one that she had only seen briefly on walks, and he would always cross the street immediately to avoid the dire possibility of crossing within awkward feet of her on the same sidewalk. Or maybe it was her that did that. He seemed to have knocked at the door and was yelling at her, dressed in his usual faded blues, from across the street. How did he move so quickly? But then she woke up, and it was clear that her neighborly interaction was just the tail end of a dream. Her dreams were always vivid, visually more distinct than reality itself, and sometimes a more interesting place to be. It was immediately apparent that something was burning. She looked down at the mattress next to her hot pink pillow: her small space heater had fallen over and was face-planted on the mattress like a toddler that had fallen over and lacked the arm strength to do anything about it. She recovered him, Delonghi was his name, and was immediately grateful to her dream neighbor’s warning. The last dream she had that related to real life was back when she was 8 years old. She dreamed of swimming in a green river, getting painfully bitten by an alligator-thing in the foot, and waking up immediately having fallen out of bed with a twisted ankle. At least this time she caught the hazard before Smokey the bear-thing showed up in her dream to roast marshmallows.
It was pitch black. Maybe she should make a smoothie, why was it so hot? The nightingale was still singing, maybe he wanted a smoothie too. She went to the bathroom quickly to resolve the prior two hours of waking up and drinking a small ocean, and then went to sit at her desk. Her mind was busy at work, and she tucked her knees up under her chin to support her massive head. And then she saw the spot on her left knee, just a hair and a freckle to the bottom right of her knee cap. Actually, a “freckle” is quite the appropriate metric of distance, because this spot used to be one. And then possibly the world’s first insight inspired by a freckle came to be. A cascade of warm, pink joy started to creep into her toes, all the way up to her knees, down again to her base, up through her torso, and then slipping out at the corners of her lips. The emergence of this smile was due to the realization that everything must change. Her angst wasn’t about the lock, or the landlord, but the same fear of uncertainty and change that made her cling to routine. There was a certain comfort in knowing the intricacies and details of her world, a foundation made of smoke and glass. For 28 years she had garnished a birth mark in that spot. It was real, certain, tangible. Then one day, it was just gone, and as silly as it seems, she learned to appreciate her new knee without its identifying mark. Her knee spot formerly-known-as-freckle reminded her that tiny details were a form of mental blankie, providing comfort in not changing, but in reality being rather inconsequential. What is true for freckles is also true for more important things. Some amount of digital money that gets buzzed from one account to another, represented as a slightly different rendering of pixels on a screen, was exactly that. It could make her feel in or out of control depending on how she decided to feel about it. And thus we stumble on the strength that comes from making choices. She felt a sudden appreciation and understanding for her landlord, and for all the freckles that never were, and used to be.
· -
The Sink
Immersed in the water, her senses were no longer preoccupied by the dollar-store sounds of traffic passing, that confused bird that sings in the dark, and the gentle bumps of neighbors moving from behind the wall. She imagined not having any neighbors at all, but rather, little people that scurried around tunnels wrapping beside the beams of the wall. Thud. Her toothbrush knocked of the counter onto the bathroom floor: the floor where things fall permanently, because no rational being would ever dare try to salvage anything. Let’s be frank. Most things in this world, cell phones, shoes, bags, and especially floors, are completely covered in poop. There is likely a negative correlation between “you think it’s-covered-in-poopness” and “actually-covered-in-poopness.” Her mind interactively plotted such a scientific idea: would her mental imagery be in R or python today? Or a different plotting software that had yet to be invented?
These were the ridicules, entire fantasies and thought processes triggered by something so small as a thud, that kept her imagination at bay. The normal inundation with daily noises also provided a constant source of material to inspire such fantasies. But now, this moment, with water up to and into the ears, granted a whole other level of freedom. She dreamed of a cloud-based environment, no, it was an entire army of servers, where people could collaboratively program. For the meek, for those obsessed with building, solving, and risking, for those for whom it comes harder to maintain eye contact, it offered companionship. Like two friends sitting next to one another quietly embracing the togetherness that comes with shared motivation behind a larger goal, they wrote while, for, and if statements side by side on the computer screen. And with the touch of a button, either could bring down the fence that separated the coding environments, allowing the other in for an allotted time to inspect a variable, share a function, or bestow invaluable knowledge to the other. The gentle passing of hours in this flow: it was beautiful, mesmerizing, romantic. And warm… wait, what is that?
There are two possibilities when you feel a sudden warmth spill across you. You have either time traveled back to being 3 years old and peed in your pants, possibly an indication that you are starting the last phase of your life, or in her case, you know you’ve been checked out into your fantasy for just a little bit too long. The sink was overflowing. She jumped back, found momentary relief that she wasn’t again 3 or yet 83, and then returned to the reality of the small, yellow-lit bathroom. Raskolnikov, is that you? The toothbrush had long passed the five second rule (a fair extension as it too is something that is put in the mouth), the tiny wall neighbors were well tucked into their insulation beds, and it dawned on her that the confused bird was in fact a nightingale. She would possibly say something to her landlord about a sink that doesn’t properly drain, but that might risk being lost in her own mind indefinitely. It was certainly a lovely place to be, a constant comedic, vibrant and active narrator to bring joy and life to the events of everyday life. It’s amazing how much can happen in the small amount of time that a sink fills with water.
· -
Mariposa Mente
You may not give a damn, but I must tell you how I am.
I have learned to navigate my microwave from button pizza to start.
At the market, I consistently place the same items in my cart.
Terror is the sweating glass that coaxes to be moved near,
that sends out its leaky loveliness to destroy my computer, my dear.
No matter the age that stamps my worth, or the numbers that you see
my excitedness over colored pens reveals the age I should be.
I don’t desire to see the world, I am happiest where I am.
Arduous and annoying defines an expensive travel plan.
That how to achieve sophistication is totally beyond me,
but halfway there is wrapping turnip greens in nori
To be driven by logic and reason, a good robot it has been said
yet I am still irrationally terrified of fruits that are red.
I won’t dress nicely, in a form that would attract.
My style and manner has no cunning, strategy, or tact.
That I feel in wonder at things with underneath spaces,
each an abyss of dropped things in hidden places.
These colorful dreams, sharper than the reality I know
take me to breathtaking places that I’ll never go.
Tell me how I must change, from your words I do run,
despite deep down knowing I shall change for just one.
That finding all those tiny bugs did not tell me clear,
that a much larger bug was lurking near.
I won’t wear makeup, you will see me in the raw.
Stinky and hideous, is the beastie that you saw.
I am never lonely, and I do not reach for the phone,
despite the fact that I am tangibly alone.
My pajamas stained in toothpaste, small pandas and kale,
My once olive skin, now smooth, and covered pale.
Spongebob square pants mouthwash is the kind of thing
that gives these days a silky, and playful ring.
Beat up toes, Achilles heels, and purple feet,
telling a story of the kind of girl you shall meet.
I do not sleep when I can, I want it when I should not.
I will not talk when others do, for conflict is not sought.
I fall in love quietly, a mental symphony of my own,
stays with me through the passing of time, never alone.
To take things so seriously, I can no longer do,
Your world a timid beige, I will paint it blue.
Wisdom comes with quiet memory, titanium dreams.
Dancing through cranial valleys, heart beat seams.
The summation of life experience is more than should be,
The deus ex machina never came, but charged a fee
the set difference of that painted blue,
it turns out is you.mariposa mente, the imperfection that you see
·
is that which makes you beautiful to me