Let’s say that I have a huge file cabinet filled with pasta (choose your favorite kind from “the Plethora of Pasta Permutations”) and I want to know the volume of each piece (let’s say there is a contest to guess how many pieces of uncooked pasta will fill a pot perfectly). For example, how about some hello kitty pasta?:

There are different shapes, and variance within one shape type, and there is no way that I would want to cook and take the volume of every single piece, then average to find the true mean, but I could take a sample of pasta, find the average volume of my sample, and use that to estimate some “true” mean volume.
Standard Error tells me how good of an estimate my sample is
The standard error, or standard deviation, gives us a sense of how far off my sample mean is from the true mean. If my sampling is unbiased, then the sample could be either a slight overestimate, or underestimate. If my sample is biased (for example, if I had some kind of hook that more easily grabbed a hello kitty and not a flower) then my mean volume estimates would probably be too big. Let’s assume my sample is unbiased. To calculate the standard deviation (s), I would first calculate the mean volume (x bar), subtract it from each sample volume, square that result, and add up all the squares for my entire sample. Since we have a sample, I would then divide by N-1, and taking the square route would solve for the standard error:
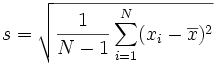
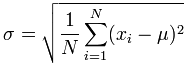
This value represents how far off any random sample is likely to be from the mean. Note that we divide by N-1 because we are taking a sample. If we are calculating the standard error for the entire population, we just want to divide by N, and note how the variable we use to represent this value has changed from s:
If we don’t take the square route, then we are just solving for the variance, and so we can say that variance is equal to the standard error (above) squared:

We typically start with variance, actually, and then just take the square route to get the standard error. What’s the difference between the two?
Standard error is (sort of) intuitive, variance is less so
I (think) the reason that we have standard error (taking the square route of variance) is because it is more intuitive. Since variance is an average of squared values, it doesn’t make much sense in the context of our data’s units. However, when we “undo” the squaring by taking the square route, we get a value that is more easily to relate to our data units. This is why I would be interesting in calculating the standard deviation for my sample of pasta. It would give me a good estimate of the average volume that I’m off by when I do a sample, which might give me insight to how many samples I should take to get a good estimate.
How is this useful in machine learning?
In infinite ways! However I will just give one example, with linear regression. If we are taking n samples of data to fit a linear model by finding the least sum of squared error, for each time that we take a sample, we would come up with some estimated beta value (B1). We would then get a distribution of B1 values, and we would want to know “what is the chance that the “true” B1 value is in this distribution? “ We would want to calculate a 95% confidence interval, and we would do this with the standard error:

Basically, the equation above says that we define a range that is 2 X the standard error of our estimate above and below it. This means that 95% of the samples that we generate will have the true value in this interval, and the other 5% are type I error.
We can also use the standard error to calculate a T-statistic, or the number of standard deviations that an estimate is from the sample mean. If we are assessing if a particular sample is “significantly different” then we would want to know if it falls within this 95% confidence interval or not. If we find that our sample is in the 5 percent of values that are NOT 95% likely to contain the true population sample mean, then we reject the null hypothesis and call the sample significant. We calculate a T-statistic by subtracting the mean, and dividing by the standard error.

If my memory serves me correctly, a t-statistic of +/-1.96 is a good estimate of the 95% confidence interval for normalized data with mean zero.
Suggested Citation:
Sochat, Vanessa. "What is Standard Error?." @vsoch (blog), 15 Aug 2013, https://vsoch.github.io/2013/what-is-standard-error/ (accessed 14 Jul 26).