I am actively walking through the NeuroSynth meta analysis code, and I thought it would be helpful (for me) to write it down. I’m interested because I noticed that when performing a meta analysis with two sets of pubmed IDs, switching the order of the ids into the function changes the resulting map. I need to know why that is. And of course I’ll forget everything entirely at some point, so I should put it here. This is a high level thinking about a chi-squared test of independence in the context of brain imaging study literature. Here is a little background.
How do we report results in neuroimaging?
In neuroimaging, it’s custom to report activation coordinates in tables. This could mean a cluster center, or a maximum value, and it could be reporting significant differences between groups, or something else entirely. For NeuroSynth, the current database does not take any context into account. We are just mining these papers for x y z voxel coordinates, and making a huge table of imaging voxel locations (about 2 million to be exact) by pubmed paper IDS (currently there are 9721 in the database). You can imagine a 1 indicates that activation is reported in the paper, and 0 not. I haven’t kept up to date with the database methods, but I remember something to the effect of a 1 being assigned to each value in this matrix within 10mm of a reported activation.
Now you understand the matrix: it shows us which papers have reported what. Now we can start to ask questions. For example, for a set of papers I’m interested in, I want to know if the x,y,z coordinates reported (the “voxels” of activation) are similar or different from some “control” set of papers. If my set of papers are neuroimaging studies about anxiety, for example, my ideal analysis would tell me, for each voxel, if the expected frequency of reported activations for this voxel (in my control set) is different from the observed reported activations (in my anxiety set). A difference in frequency could mean that you are more likely to see those voxels of activation reported in anxiety papers. That translates to suggesting that the literature is showing those regions of the brain to be more strongly associated with our set of papers. If our set of papers are about anxiety, we can then infer that those parts of the brain are the important ones in the experience of anxiety. This is why NeuroSynth is considered a “meta” analytical approach: it aims to summarize the literature in the database to come to a “large-scale” understanding of what we have studied about the brain.
##
How should we report results in neuroimaging?
Methods like NeuroSynth have come to be because sharing data, or results, in neuroimaging is really hard. The files are really big. Everyone analyzes their data differently. Some PIs are incredibly protective of their data and don’t want to share until all analyses have been sucked dry. This line of thought is outside of the scope of this post, however I can’t continue without saying something. In many fields (genomics comes to mind, proteomics, drugs), we are pretty good at sharing data. All of that data is just glorified text files, right? It’s a lot harder in imaging, because of the complexity of the data. However, we are getting better! I’m excited about projects like NeuroVault, OpenFmri, ABIDE, LONI, NDAR, HCP, INDI, and I could probably go on. The problem we still face, however, is that it’s really hard to bring together lots of researchers’ data to make inferences over, and even harder to connect to other kinds of data (behavior, genetic, metabolic, clinical, etc) or even simple things like demographics. There are huge privacy issues – seeing someone’s nose, or having just a few fields of demographics, is usually enough to identify the person. So, the next decade of important work in neuroscience (and what I hope to be a big part of, just let me finish up this graduate school thing!) is going to be designing infrastructure to work with neuroimaging in a “big data” way. That’s all I’ll say about that.
The Chi-Squared test of Independence in context of voxels
Returning to the original goal: We start with two sets of pubmed ids, the first is for some “feature” of interest, and the second serves as a control. The control could be the entire database of NeuroSynth (sans our papers of interest) OR a different set entirely. Now I am digging into the NeuroSynth meta analysis code. We call these two sets of ids “ids1” (feature) and “ids2” (control). The script checks to see if the second set exists, and if it does, we use ids2 as the control. If it doesn’t, then the control is the rest of the database. For this example, I’m going to say that ids1 has 16 ids, and ids2 has 18. Remember that, for each voxel, we are counting the number of papers that report activation in that voxel in the first set versus the control. We want to know if there is a different proportion of counts (reported activations) between the feature and controls.
We first calculate the probability of the “feature” – meaning the number of pmids in ids1, divided by the total number of mappables (16+18) = 34
pF = (n_selected * 1.0) / n_mappables
Ah, here it is! My question is answered… where is the Staples button? This is why there is a difference between giving the method one vs the other ordering of the ids. In one case we get a pF of 0.47, and in the other we get 0.53. We are just switching between the feature set and control. This is to say that the “probability” of the feature (the papers tagged with something you found interesting) as a percentage of “all the papers” (the entire set of 34) is X. Next the script is essentially counting things, and calculating probabilities. I found a fantastic site that reviews how to do the test, and I’ll try to summarize the high level stuffs.
For each voxel, we are basically making a table of counts for our feature of interest versus activation being present or activation. I think it would look like this:
Voxel x,y,z
[su_table]
| Count if Activation Reported | Count if Activation Not Reported | |
| Papers in set “ids1” | a | b |
| Papers in set “ids2” | c | d |
[/su_table]
You can use this table in context of the explanation at the link above. The null hypothesis says that whether activation is reported (or not) is independent from our feature of interest (meaning that the distributions of counts are pretty much the same between ids1 and ids2). If we reject the null hypothesis, it means that we’ve found activation to not be independent of the feature, meaning that the distributions are in fact different! We can take a look at the equation:
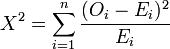
the O guy is the observed frequency (the count of voxels with reported activation in our set of ids1 papers) and the E guy is the expected frequency (the control, or number of activations for that coordinate in the set of ids2). SO if those two things are the same, we basically wind up at zero. When we subtract the two, the difference is called the residual, and squaring it ensures that we don’t have a negative number. We are using the test to ask for the probability that our “feature” (the activations reported for a single voxel across all papers in ids1) are independent from the control (the other set of papers). If, at one voxel, there is no difference in finding activation for the set of papers in ids1 vs ids2, then we fail to reject the null hypothesis. My interpretation of that in “Vanessa human” language is that the literature is the same for the papers. Thankfully, you (and by you I mean me) don’t have to do this test out by hand – there are plenty of functions in R and python to perform the test given an input table, and spit out a p-value. For neuroimaging, however, remember that we are performing this test at every single voxel, and so we must adjust our p-values for multiple comparisons. A significant result suggests that there is a significant dependence between the feature of interest (represented in the set of papers) and activation at that voxel.
I should probably get back to work! Coding is great, but sometimes it’s a good practice to read and write about things.
Suggested Citation:
Sochat, Vanessa. "Chi-squared test of independence for neuroimaging meta analysis." @vsoch (blog), 06 Nov 2014, https://vsoch.github.io/2014/chi-squared-test-of-independence-for-neuroimaging-meta-analysis/ (accessed 14 Jul 26).