We need to start getting a bit obsessive about understanding our containers, and in this post I will discuss some continued work to help you do just that. It’s a bit long, so choose whichever parts are of interest to you.
- Part 1: Data structures and functions to build container trees.
- Part 2: Visualizations of trees and tree comparisons
- Part 3: Discussion about research tooling and practices
Part 1: Data Structures
Earlier in the month I created a wrapper to Google’s container-diff that would perform the same function for Singularity containers. I also created a static community API that would dump the results of this tool into a Github repository so you could query it without needing to run anything. If you need a refresher on the detalis, I wrote about both of them here.
Why should I care about these resources?
You would be interested in these resources if you are interested in studying changes in container software or “guts” over time, or how differences between containers can influence an outcome variable of interest. For example, I might try running the equivalent script over a set of versions of a container, and seeing if I can link changes in resource usage or analysis result with some software change in the container.
How would I use these resources?
I would expect a general use case might look something like the following:
- Grab lists of container files from the API
- Parse with your software of choice into some data structure
- Do cool analyses to compare containers!
The last part is mostly up to you, meaning that you would have a specific research question in mind and outcome variable to investigate in context of a specific set of containers. What I want to show you today is how to do everything up to that point. Specifically, I have created functions and examples for you to make several types of pretty trees and heatmaps to compare containers based on their filesystems. Let’s jump in!
Why Trees?
I’ve always liked visualization of filesystems as trees, and so this seemed like a good place to start. I created a tiny package called containertree that will help us to calculate and generate visualizations that compare containers. I decided to start with a data structure called a Trie to represent the filesystems. Trie’s, also known as “prefix trees,” are pretty useful to store letters at each node and then build up a vocabulary. Here is the picture from Wikipedia:
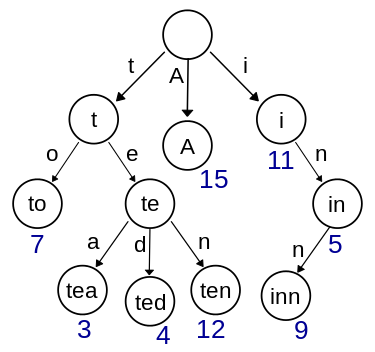
Try starting at the top, and tracing the right nodes in the tree to spell the work “tea.” You can follow a similar path to form the word “ted,” and
you are efficiently storing the letters because the nodes for “t” and “e” are shared. Now you can imagine that instead of letters, we have filesystem folders like “bin” and “etc”. Two files in “bin” (/bin/echo and /bin/sh) will both originate from the “bin” node.
The basic idea is that if we trace nodes down to the leaves we form a complete file path, and we can stop anywhere in-between
and have a subfolder path of it.
It’s overly simple and obvious, but then again, the best things are like that.
Metadata
Within each node, we can store some metadata like size and count of containers represented there, along with a full list of tags for the container names. Let’s zoom ahead and look at a node, and I’ll explain how to create them later.
# Here we generate the Trie from a url that points to a json list of files
tree = ContainerDiffTree(url)

# here is the motha node, the root
root = tree.root

# The root has children, the first level in our Trie tree!
root.children

[Node<bin>,
 Node<boot>,
 Node<dev>,
 Node<environment>,
 Node<etc>,
 Node<home>,
 Node<lib>,
 Node<lib64>,
 Node<media>,
 Node<mnt>,
 Node<opt>,
 Node<proc>,
 Node<run>,
 Node<sbin>,
 Node<singularity>,
 Node<srv>,
 Node<sys>,
 Node<tmp>,
 Node<udocker>,
 Node<usr>,
 Node<var>]

# We can inspect a particular child node
child = node.children[0]
# Node<bin>

# The child is labeled with the container(s) that have it that were added to the tree
child.tags
{'54r4/sara-server-vre'}

child.name
'/bin'
The reason I took this approach is because we can build a single tree (Trie) that maintains information about paths for multiple containers, and then do a calculation to compare any subset of containers by walking the tree. I will walk through some basic algorithms I implemented, and I hope that others will contribute their creativity to make the library better! Good algorithms, even if not perfect to start, start out with a strong data structure.
Classes of Trees
The ContainerTree class is a generic class that expects the input data to be json,
either from a file or a http address. Since I’m pretty excited about Google’s ContainerDiff
and this produces a (slightly different) data structure for files, I also implemented a
ContainerDiffTree class that will subclass the data loading function and result in the
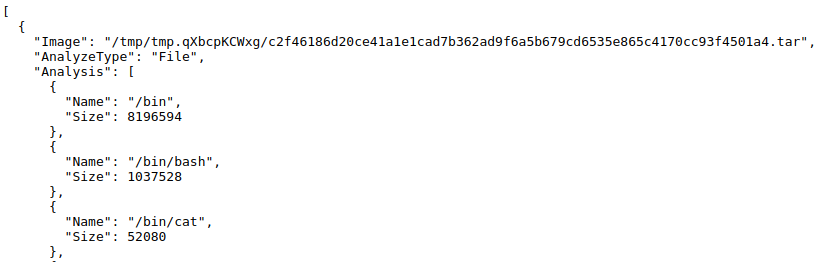
same functionality. For example, here is what Google’s data structure (output) looks like from container-diff:
[ {
  'Analysis': [
   ...
      {'Name': '/etc/ssl/certs/93bc0acc.0', 'Size': 1204},
      {'Name': '/etc/ssl/certs/9479c8c3.0', 'Size': 1017},
   ...],
  'AnalyzeType': 'File',
  'Image': '/tmp/tmp.qXbcpKCWxg/c2f46186d20ce41a1e1cad7b362ad9f6a5b679cd6535e865c4170cc93f4501a4.tar'}]
The other fields are important, but all I needed for container-tree was the content of Analysis.
Why are you telling me about these data structures?
The high level idea is that if you have “your special data structure” that needs custom parsing to get a simple list of files and attributes, this is the approach you can take. Reach out if you need help.
Examples
Here is the plan Stan! Today we will review the following:
- Grab lists of container files from the API
- Parse with your software of choice into some data structure
- Do cool analyses to compare containers and visualize!
Let’s first walk through some basic examples so you can get a feeling for how the Trie looks and works. For detailed installation and usage of the library (and all these following examples), I’ll direct you to the repository base .
Create a Tree
To create a tree, we are going to use the Python requests library to get a list of containers in a json data structure
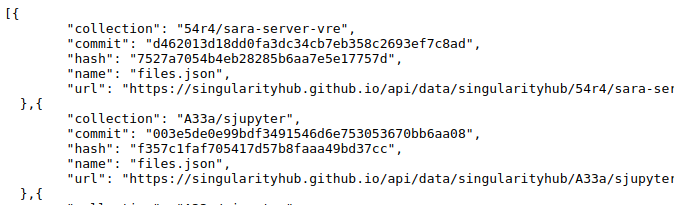
each with an associated url that is a complete json of the files (the export from container-diff).
This is the statically served container-api, a la magic of Github pages! <3
from containertree import ContainerDiffTree
import requests

# Path to database of container-api
database = "https://singularityhub.github.io/api/files"
containers = requests.get(database).json()
At this point, we have a huge list of containers, and each has an associated URL. We can build the tree from the first.
# The first entry in the list is a record for a container
entry = containers[0]

# Google Container Diff Structure
tree = ContainerDiffTree(entry['url'])
Query a Tree
We now have a tree! Here are some basic ways to query it.
# To find a node based on path
tree.find('/etc/ssl')
Node<ssl>

# Trace a path, returning all nodes
tree.trace('/etc/ssl')
[Node<etc>, Node<ssl>]

# Insert a new node path
tree.insert('/etc/tomato')
tree.trace('/etc/tomato')
[Node<etc>, Node<tomato>]
and we can count nodes too! Here we see inserting an equivalent file in the tree (perhaps from another container? some other analysis we are doing?) and then returning the count!
# Get count of a node
tree.get_count('/etc/tomato')
1
tree.insert('/etc/tomato')
tree.get_count('/etc/tomato')
2
Add Containers
More realistically, what I wanted to do is load another entire container and add all of its files and folders to the tree in one shwoop. Thus I created the “update” function:
# Update the tree with a second container!
new_entry = containers[1]
tree.update(new_entry['url'])
But I’d also want to keep track of what containers are represented at each node (file or folder). To do this, I added a set of tags to be stored at each node. When we create or update a tree, we can associate a tag with a container addition, and the tag will be added to the nodes that are updated. Let’s redo the above but use tags:
# Build the tree and ensure it has a label!
entry1 = containers[0]

# The API serves the collection name with the files list url
tag1 = entry1['collection']
'54r4/sara-server-vre'

# Now build a tree, give it the label!
tree = ContainerDiffTree(entry1['url'], tag=tag1)
Once we’ve built the original tree, we can inspect the root node to see it is labeled.
# What are the tags for the root node?
tree.root.tags
['54r4/sara-server-vre']
Now when we update the tree, we can also label the new nodes with a label.
entry2 = containers[1]
tag2 = entry2['collection']

# Update the container tree with the second container
tree.update(entry2['url'], tag=tag2)
Now we can again inspect the root, and see that there are two containers represented.
# What are the tags for the root node?
tree.root.tags
# ['54r4/sara-server-vre', 'A33a/sjupyter']
Awesome! You can imagine having a tagged Trie will be very useful for different algorithms to traverse the tree and compare the entities defined at the different nodes! In fact, I’ll show a simple comparison I did using this Trie.
Comparisons
Once we have added a second tree, we can traverse the trie to calculate comparisons! I decided to generate a simple score that represents the percentage of nodes defined in one or more containers (call this total, you can imagine it’s the union of the two container sets of files) that are shared between containers (represented in BOTH containers).
I’ll show you this algorithm because it’s pretty cool, I wound up using recursion!
    def similarity_score(self, tags):
        '''calculate a similarity score for one or more tags. The score is
           a basic information coefficient where we take into account:

           1/ the number of total nodes in context of the tags, meaning
              we add any node that has one or more of containers there
           2/ the number of nodes where the tags are all present
           3/ the number of nodes where one or more tags are missing
        '''

        total = 0       # total number of nodes with one or more
        intersect = 0   # all tags present at nodes
        diff = 0        # one or more tags missing

        def traverse(tags, current, total, intersect, diff):

            # All tags are represented in the node
            if all(t in current.tags for t in tags):
                intersect+=1
            else:
                diff+=1

            # If any of the tags are present, we add to total
            if any(t in current.tags for t in tags):
                total+=1

            # Iterate through children, add to data structure
            for child in current.children:
                total,intersect,diff = traverse(tags, child, total, intersect, diff)

            return total, intersect, diff

        # Return data structure so the user knows the components
        total, intersect, diff = traverse(tags, self.root, total, intersect, diff)

        result = {'total': total,
                  'tags': tags,
                  'same': intersect,
                  'diff': diff }

        # Calculate score, percentage of nodes shared

        result['score'] = 0
        if total > 0:
           result['score'] = intersect / total

        return result
This function is part of the ContainerTree object, hence the reference to self.
The last little bit just calculates the intersect (shared) over the total to get
my score. You could calculate any sort of metric that you like, really.
Here is what the above looks like, in action!
# using the tree from above, where we have two tags
tags = tree.root.tags
# ['54r4/sara-server-vre', 'A33a/sjupyter']

# Calculate the similarity
scores = tree.similarity_score(tags)

{'diff': 44185,
 'same': 12201,
 'score': 0.21638349945021815,
 'tags': ['54r4/sara-server-vre', 'A33a/sjupyter'],
 'total': 56386 }
In the above, we are traversing the tree to count nodes that are shared (and not shared) between the two
tags ['54r4/sara-server-vre', 'A33a/sjupyter'], each of which is a different container that was added to the tree.
We can see from the final score data structure that across the ~56k nodes in the tree, the two containers shared about 12K (the nodes
had both labels) and differed by the other 44K (meaning one container was defined at the node, but not the other). This means the containers
have about 21% similarity with respect to the filesystems.
I have no interesting questions to ask, so instead I went to town to create visualizations and heatmaps to show these comparisons. For example, here is the first heatmap that I made for a small subset. I’ll discuss a harder problem of scaling this later in the post. Let’s first talk about visualization of the filesystems themselves.
Part 2: Visualizations
Trees
Let’s have some fun! I really wanted a nice visualization to show a tree for just one, or perhaps more than one, of these comparisons. I’ll show you the visualizations that I came up with, and remember that complete code is available if you want to use the library to create one on your own. And if you want any help, or a new visualization, I hope that you ask me. Seriously, I get bored really easily when I run out of fun things to work on :)
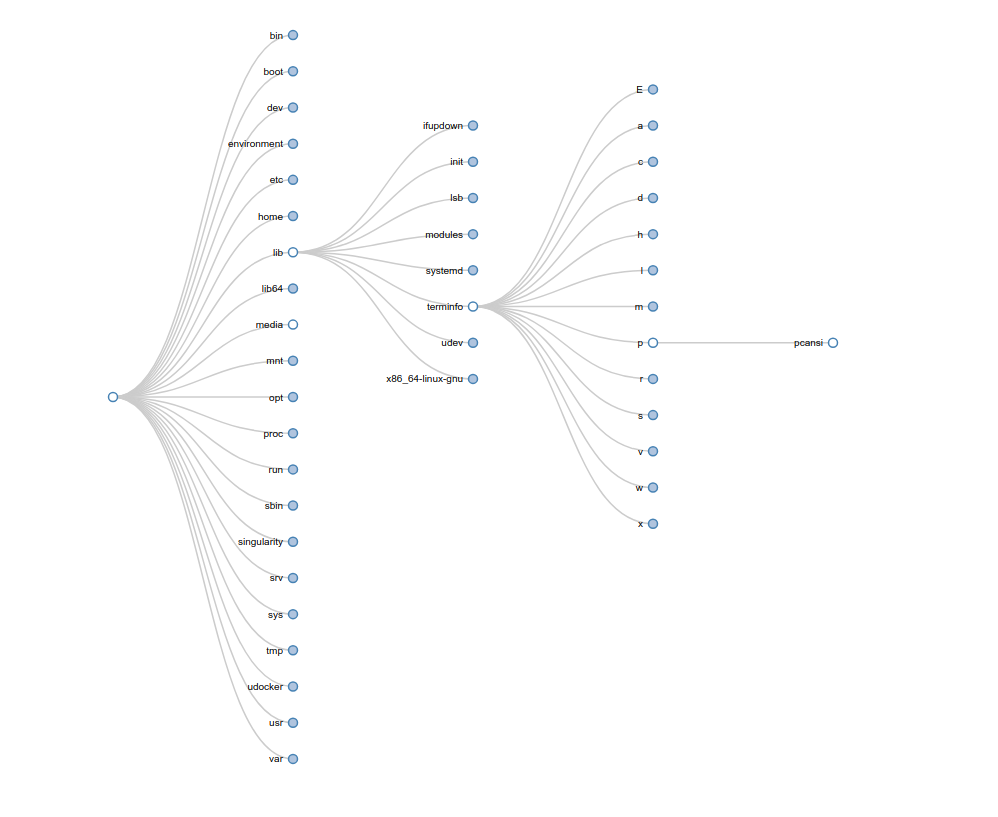
First, here are some hierarchy-like trees.
A General Tree is your basic bread and butter d3 tree that Mike Bostock has made famous. I don’t know him, but his work is amazing. I mean, it’s so elegant and lovely, you can’t improve much upon it’s simplicity.
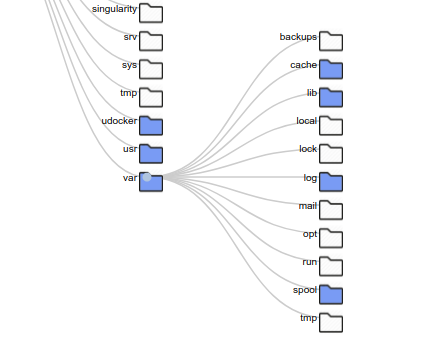
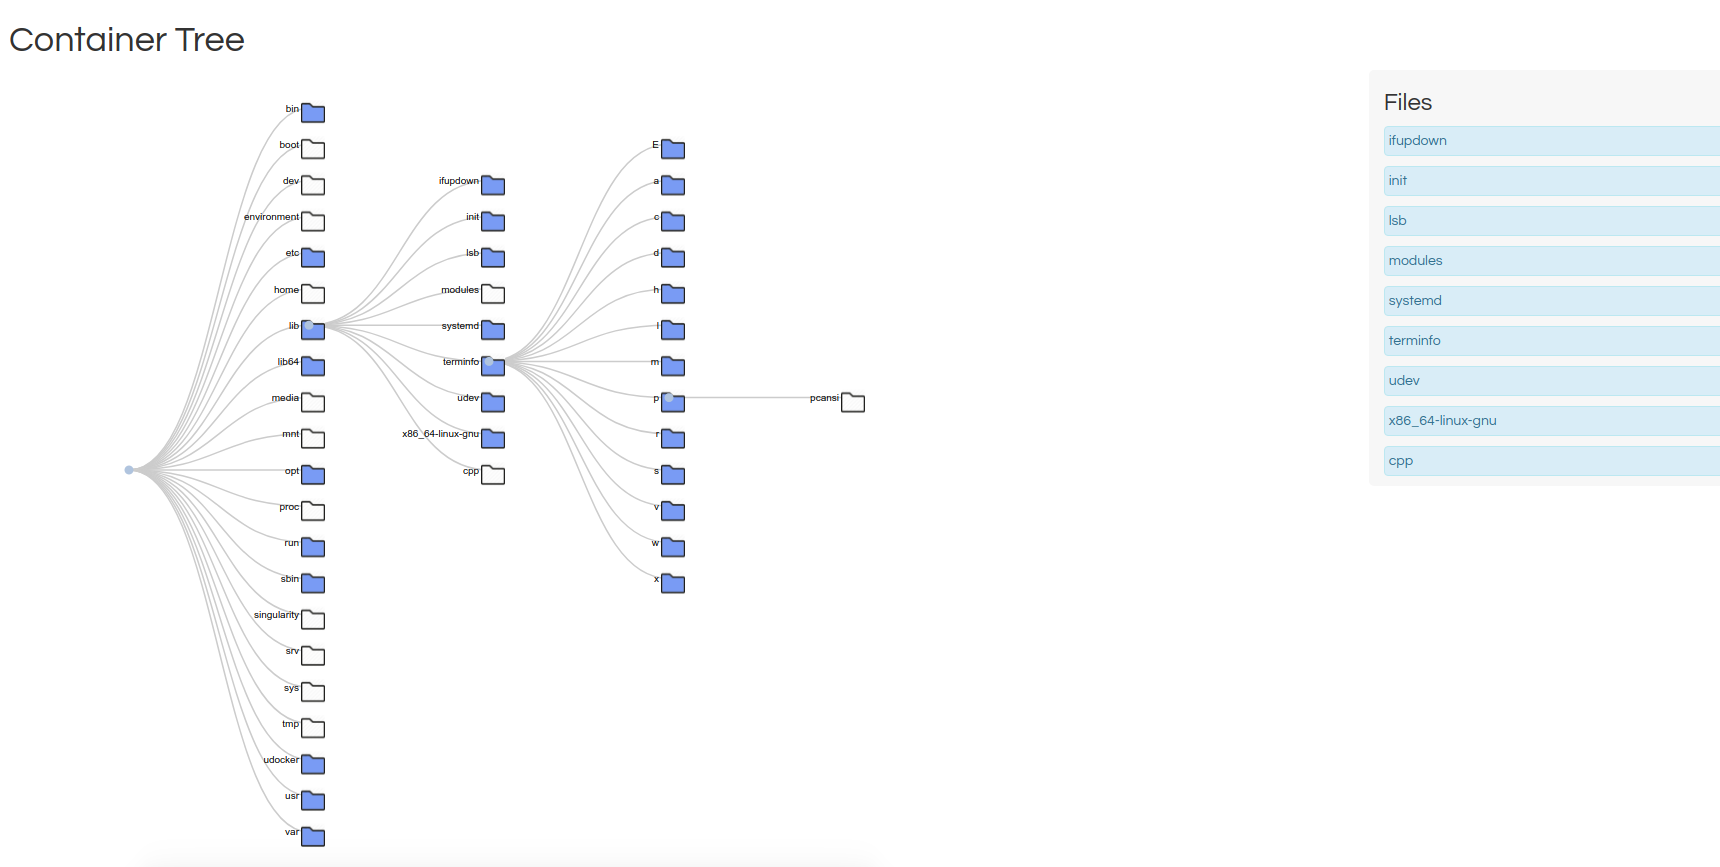
Files Tree is my favorite for this use case, because it shows the files in each folder on the right, and has simple icons to tell you that you are browsing a file hierarchy. I could imagine pairing this with inotify and a dynamically updating page to create a really simple (live) file browser.
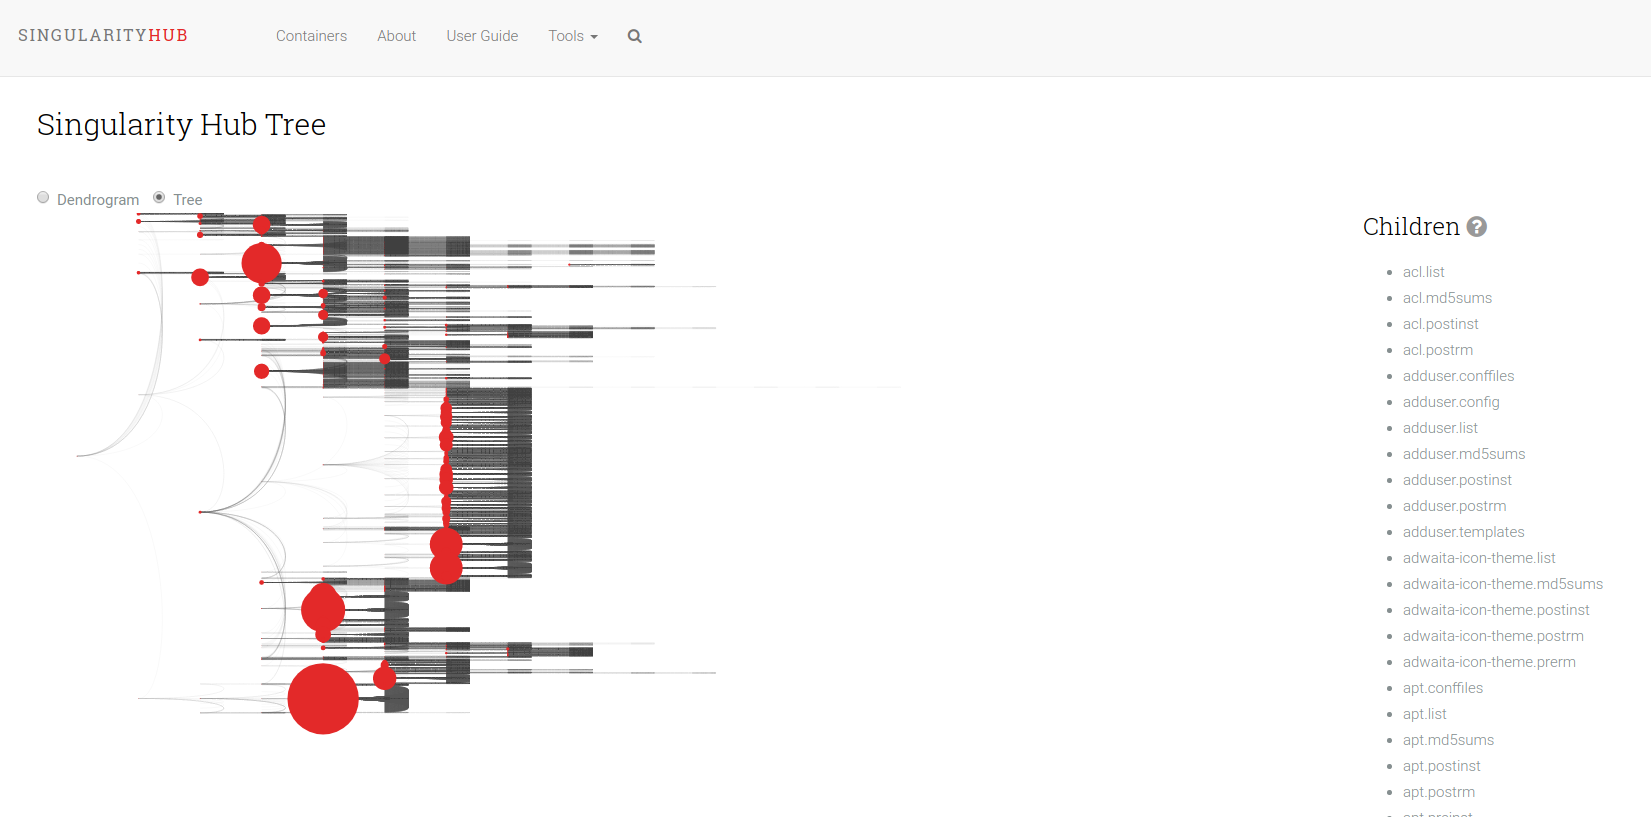
The Shub Tree (where “shub” is in reference to “Singularity Hub” mimics a summary plot on Singularity Hub, and is the least successful of the three. I can still share it and tell you what I was trying to get at. Unlike the other two, this tree represents more than one container. Actually, there are just under 200 containers represented here. The basic idea is that the size of the circles represent a count of containers that have a particular file. So a larger circle means it’s shared between more containers. It was also less successful because its rendering takes too long in the browser. This is one of the challenges with creating nodes in the DOM. After you hit maybe a few thousand, it just freezes. The way around this is to use canvas, here is an example of 150K points in just a few seconds. I think webGL would work too, but I haven’t seen it done much for simple scientific plots (maybe you have?).
Heatmaps
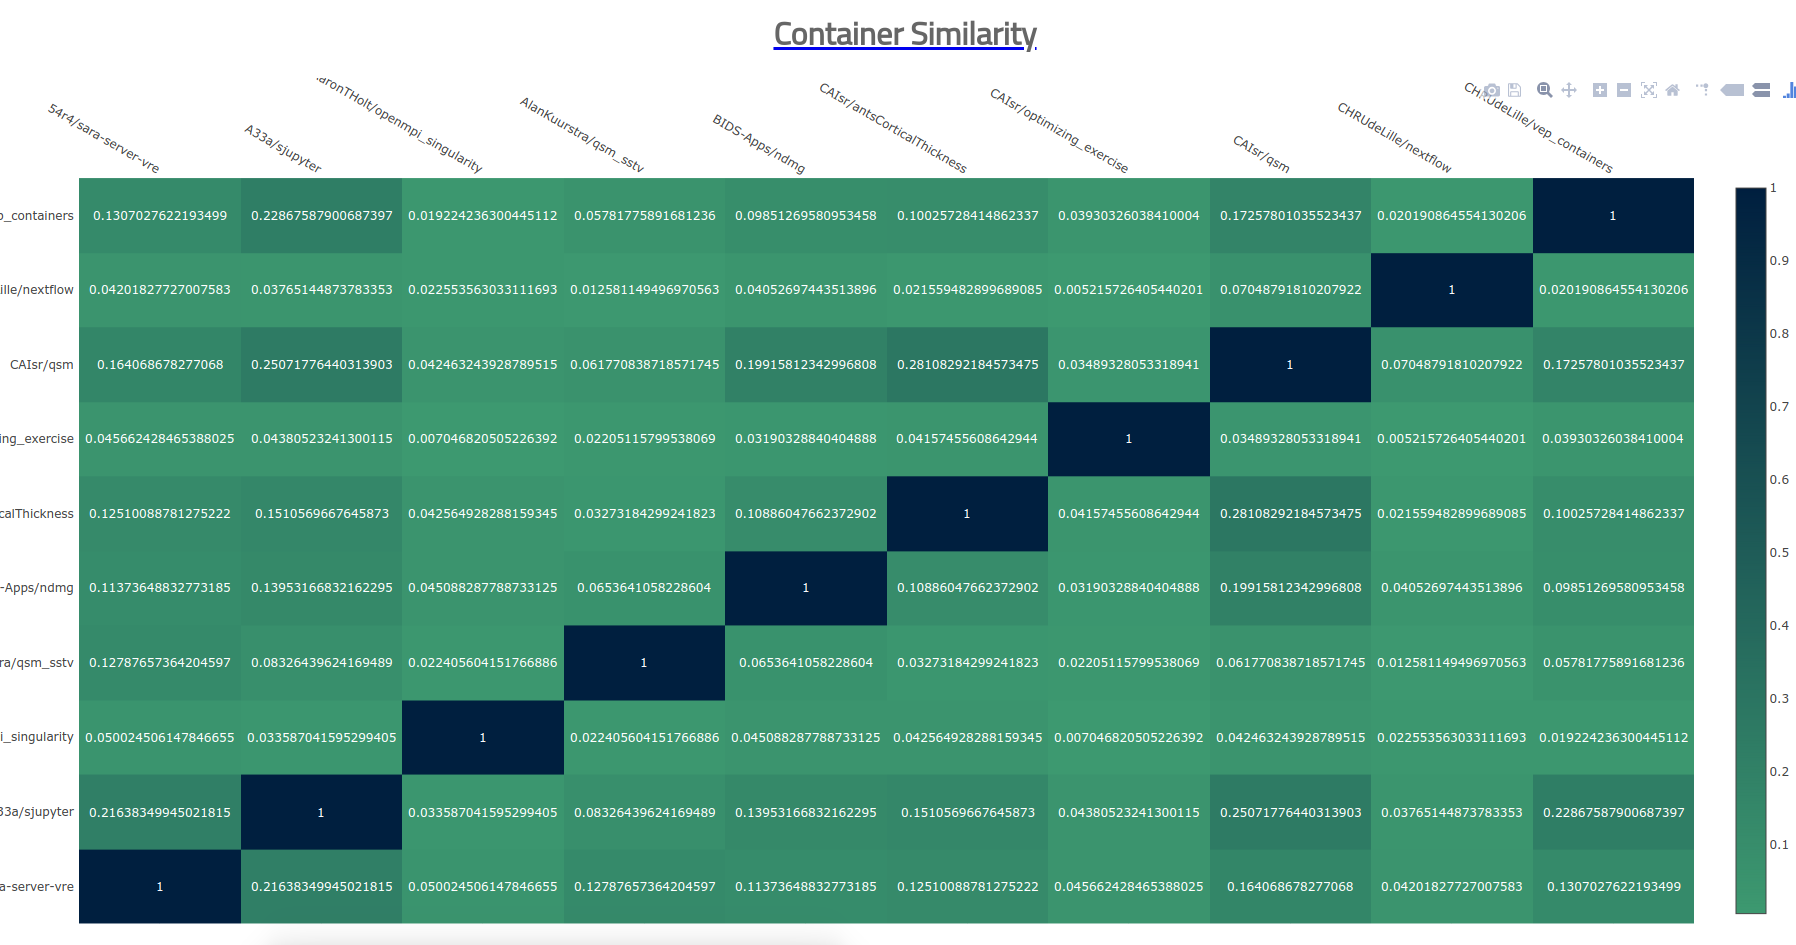
The above trees are good mostly for single (or summary trees) but what about when we want to show differences? Nothing beats the simple heatmap! This is the bread and butter of biology and genetics, and it can be used for containers too :) As I mentioned earlier, the simple container heatmap that I created works well for a small number of containers. Here it is in action to compare, pairwise, 10 containers.
It doesn’t give any data scientists shivers, but it sort of works. I of course wasn’t happy with this, and wanted to go bigger and better! I went on a huge side-track journey to the end of the earth and back (cough, using our shared research cluster) and wrote up a tutorial for doing this for anyone that wants to go there. Now almost two days later, I think I did a little better, but learned that the bigger part is (still) pretty hard. Before I describe through the journey, let’s step back and point out how the visualization functions we have just shown work:
- The input data is programtically parsable, predictable
- The Trie object and comparison functions can derive pairwise scores automatically
- We can thus generate a consistent data structure shared between visualizations
For example, most of the above visualizations have shared code that looks like this, with the only variation being the name of the template that we ask to use.
# Here is our tree with some N containers
print(tree)
# ContainerTree<38008>

# We have generic functions to get and serve a template
from containertree.utils import get_template
from containertree.server import serve_template

# Copy the file to some webroot
import shutil
template = get_template('files_tree')
shutil.copyfile(template, "/tmp/index.html")

# Another generic function to export the (again generic) data structure for the visualization
tree.export_tree(filename='/tmp/data.json')

# And then we serve it!
serve_template(webroot)
So the cool thing about what we did first is that we can produce any of the visualizations using
the same data.json but just varying the template we choose, this part:
template = get_template('files_tree')
template = get_template('shub_tree')
template = get_template('tree')
And then the export is consistent too! Here is the function. In all cases, we can easily export the same data structure based on traversing the nodes.
    def export_tree(self, filename=None):
        '''export a data structure for a weighted, colored tree

           Parameters
           ==========
           filename: if defined, write data to file (and return) otherwise
           return data structure
        '''

        # We will call this recursively

        def traverse(nodes={}, current=None):

            if current is None:
                current = self.root

            new_node = {'key': current.name,
                        'name': current.name.split('/')[-1],
                        'tags': current.tags,
                        'size': current.size,
                        'attrs': current.get_attributes(),
                        'children': [] }

            if len(nodes) == 0:
                nodes.update(new_node)
            else:
                nodes['children'].append(new_node)

            # Iterate through children, add to data structure
            for child in current.children:
                traverse(nodes=new_node, current=child)

        nodes = dict()

        if self.data:
            traverse(nodes, current=self.root)

        return nodes
You’ll notice that the function “traverse” that is called recursively is located
inside of the function, and this is because we need to be able to define the “nodes”
dictionary outside of it, and then pass it by reference and update it within the function.
If it were outside the scope of this function, we would get an empty dictionary (nodes)
back and be confused. It’s also important to call nodes.update and not anything like nodes =
because this again would lead to an empty nodes dictionary.
These three steps to get a template, generate some data, and shove them together to be served by a web server was a slightly modified version of this, because we needed to calculate comparisons first!
# Generating comparison tree!
# Adding 54r4/sara-server-vre
# Adding A33a/sjupyter
# Adding AaronTHolt/openmpi_singularity
# Adding AlanKuurstra/qsm_sstv
# Adding BIDS-Apps/ndmg
# Adding CAIsr/antsCorticalThickness
# Adding CAIsr/optimizing_exercise
# Adding CAIsr/qsm
# Adding CHRUdeLille/nextflow
# Adding CHRUdeLille/vep_containers

# Here is a (very non optimal) for loop to calculate pairwise comparisons
score_matrix = []

# Now we can generate a little matrix of similarity scores!
for container1 in names:
    score_row = []
    for container2 in names:
        result = tree.similarity_score( tags=[container1, container2] )
        score_row.append(result['score'])
    score_matrix.append(score_row)

# Same deal here, functions to get and serve the template
from containertree.utils import get_template
from containertree.server import serve_template
import shutil

template = get_template('heatmap')
shutil.copyfile(template, "/tmp/index.html")

# But here it's different, we export the score matrix with X and Y labels
data = {"data": score_matrix, "X": names, "Y": names}

# Save this to data.json
with open('/tmp/data.json') as filey:
    filey.writelines(json.dumps(data))
In the above, we first add each of 10 containers to a single tree. We then calculate pairwise comparisons between the containers, and generate a list of lists, where a row represents all similarity scores for one container to the other containers. We then use the same functions to get the template file, save it to some folder, export the data, and then we would serve a simple web server there.
I was content with having this kind of similar export done between my different kinds of heatmaps. It seems reasonable to me that I cannot provide a “one line and done” equation for the user given that I don’t know the kind of comparison or groupings to be done, but I could provide enough examples for the user to follow.
Where does this simple approach break?
This strategy breaks in the real world when the data gets too big. When I got excited and ran a crapton of comparison jobs on Sherlock to create a yuuuuge matrix, I tried loading it with the simple heatmap above and what happened? Well after about 5 minutes of waiting, I saw a pretty terrible picture show up in the browser.
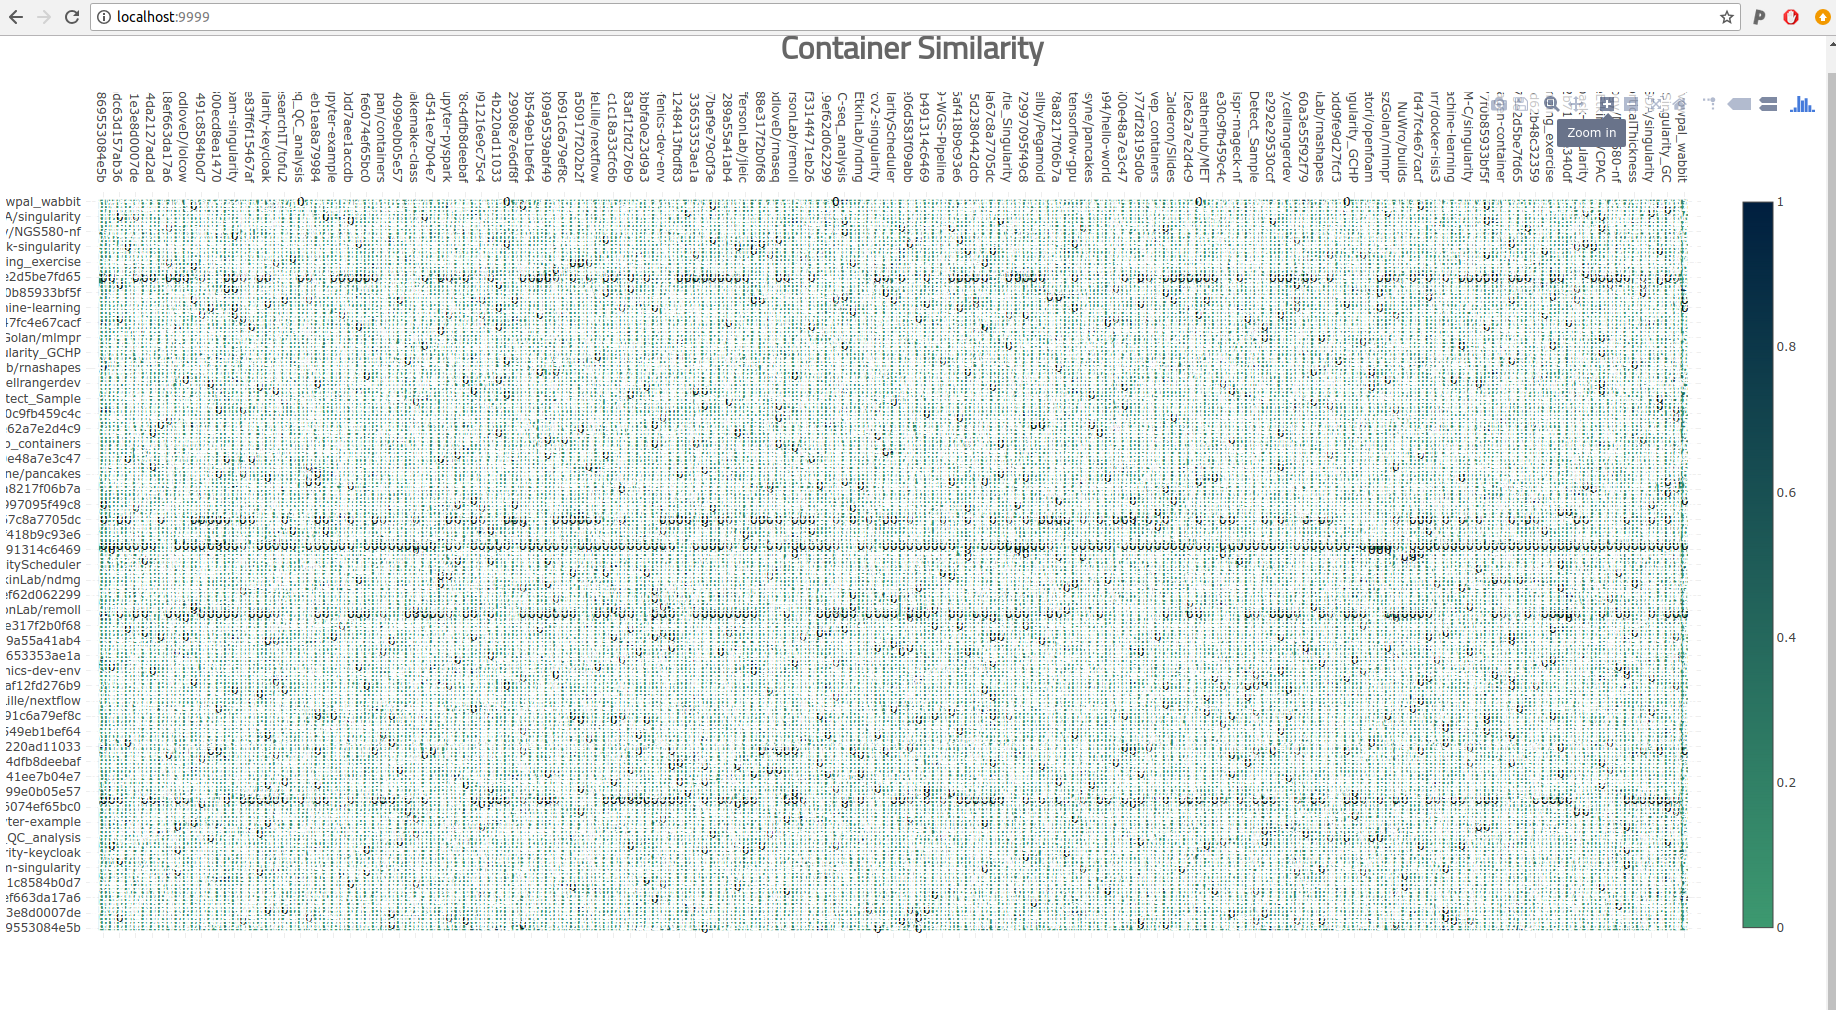
The labels weren’t even aligned, there was no way we could squeeze in just the 193 containers. The sad part is that 193 isn’t even that much. Could I zoom in to get a better picture?
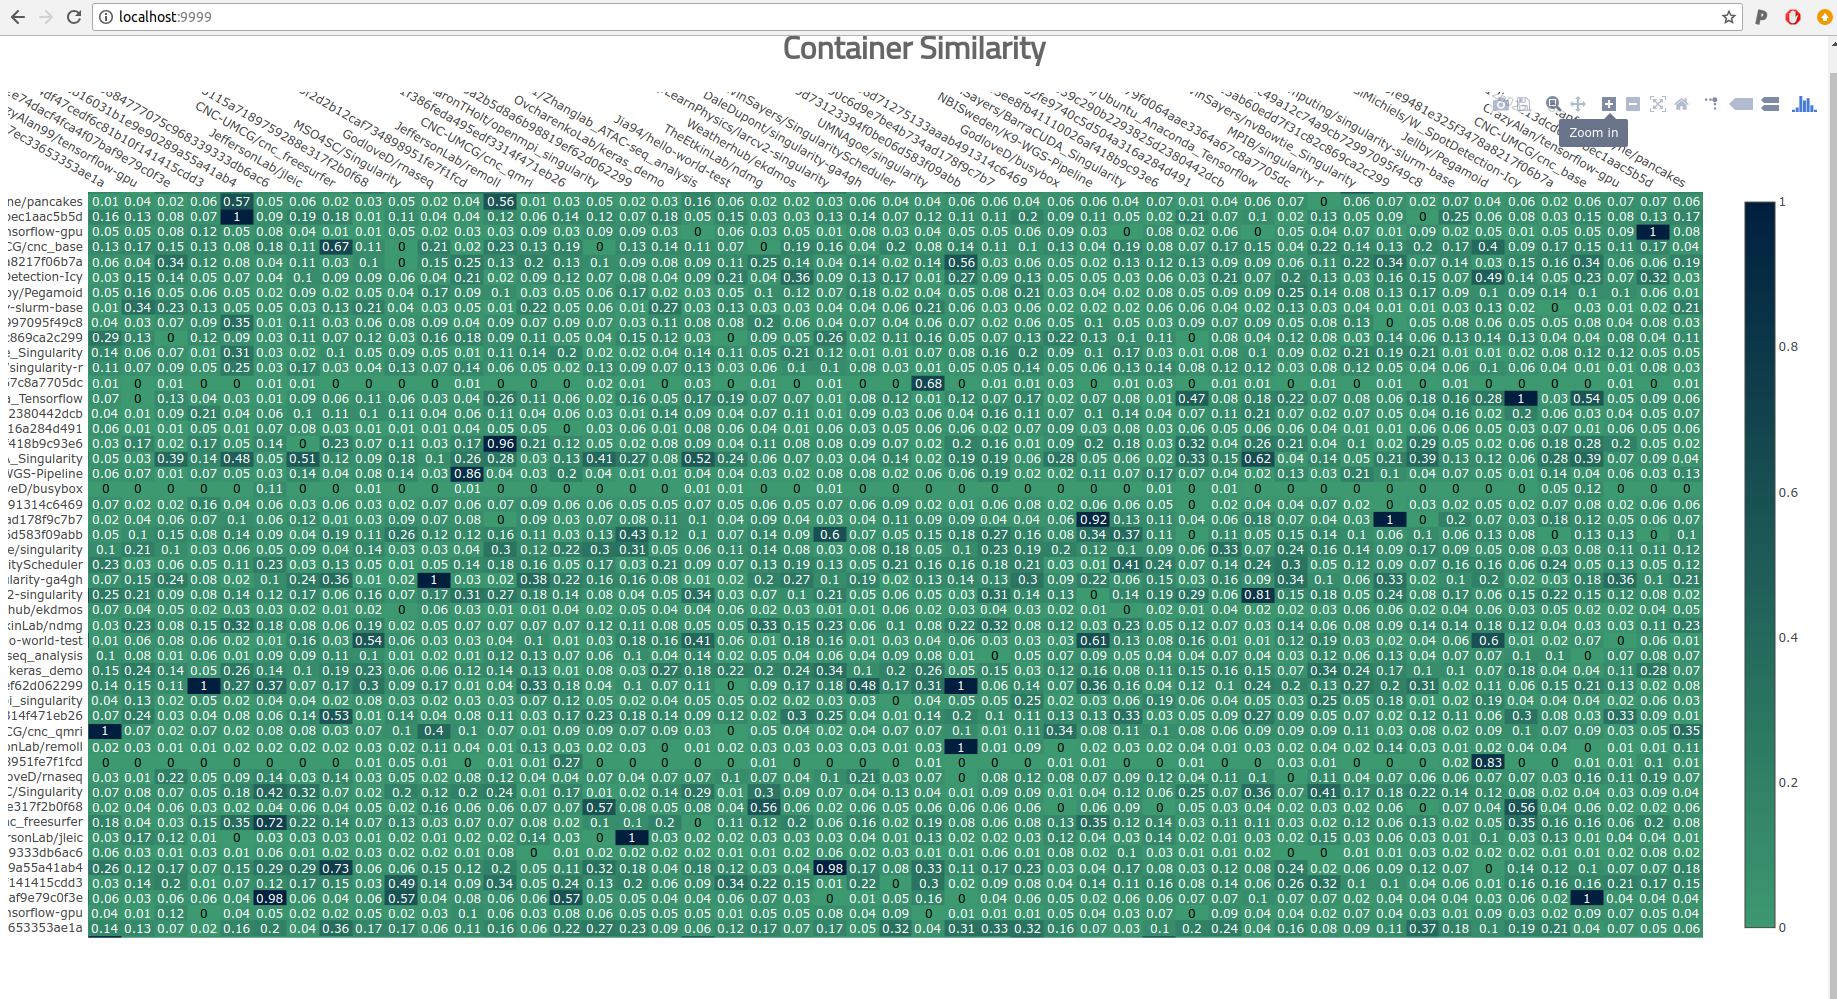
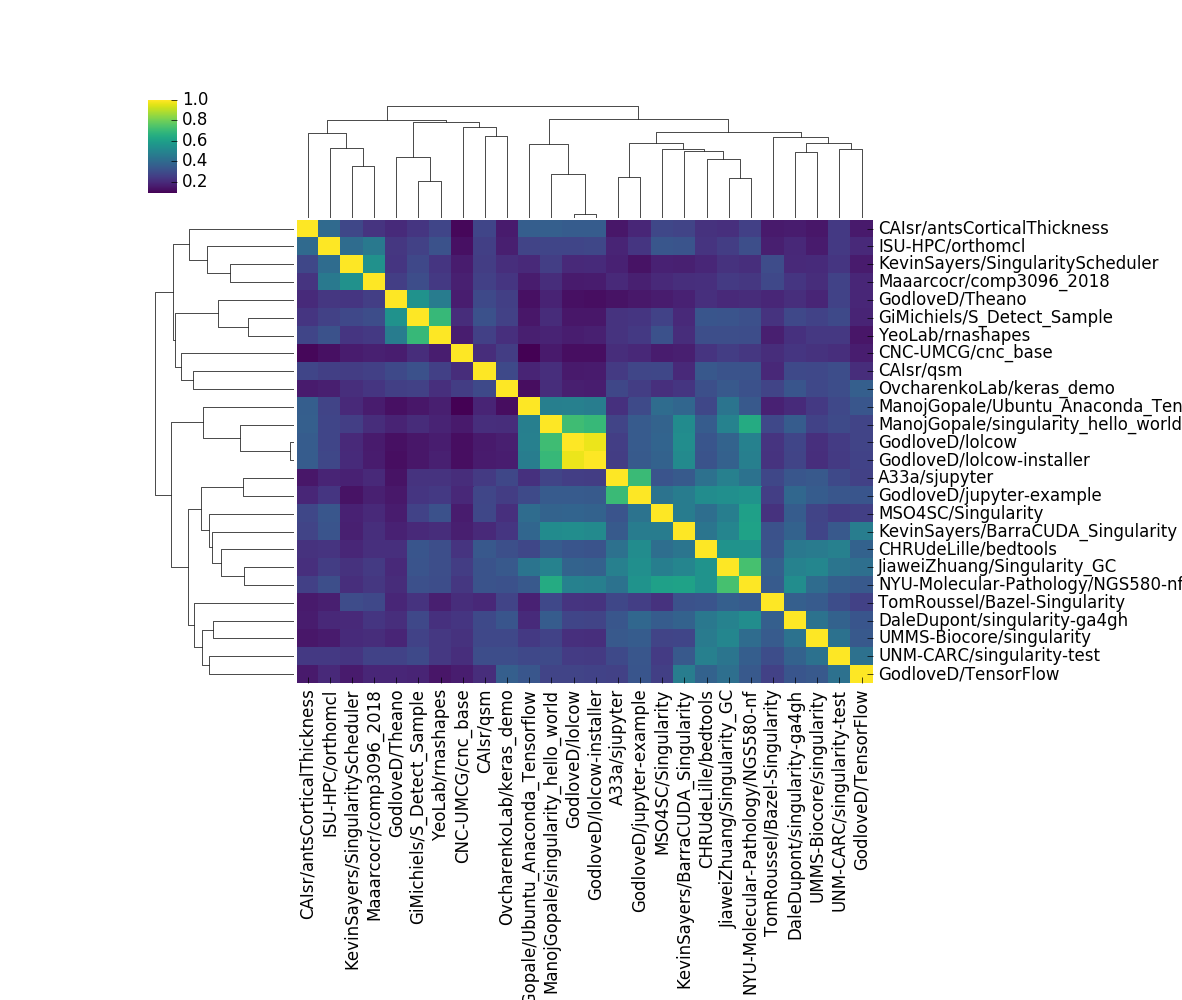
Sort of? This picture with clustering of the containers might give some sense of higher level groupings, and maybe it would work with a super high resolution PDF, but there is a main problem here.
These visualizations aren’t meaningful.
Crap. So I tried filtering down the set of containers, and removing those that were mostly 0s (not similar to any other containers) just to see if the plot could be more easily viewed.
Useless Heatmap
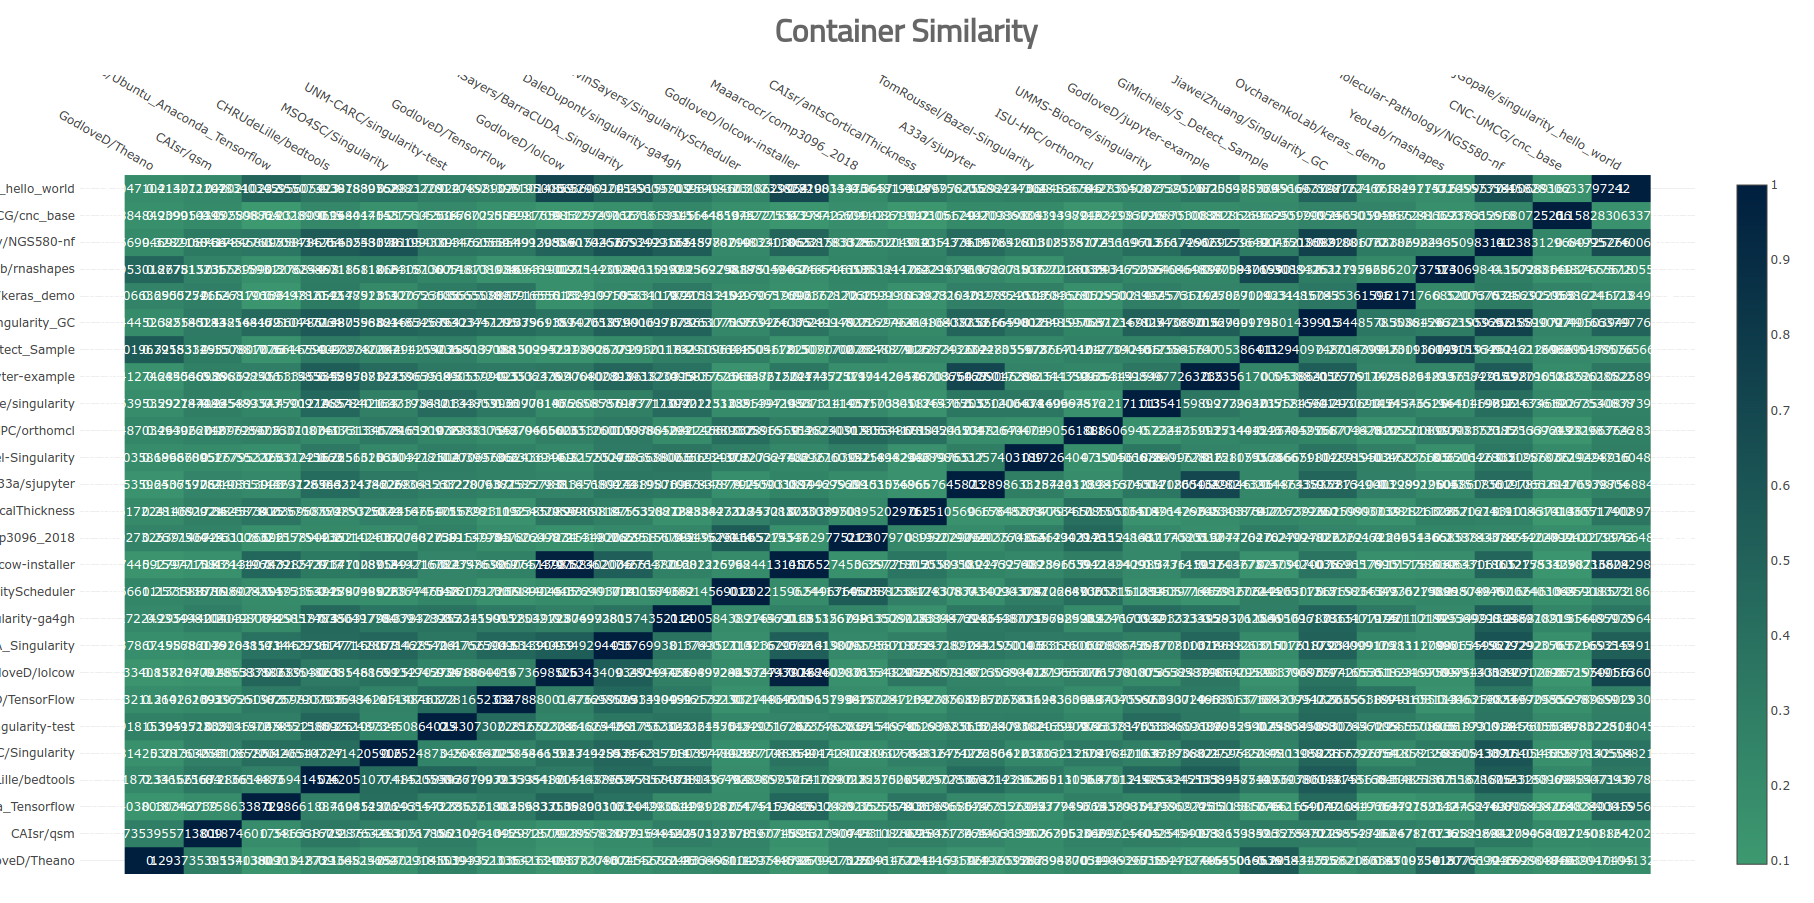
Nope, that’s pretty bad. I stepped back, because I needed to rethink why I was making this in the first place. I went to a more “quick and dirty” effort to create my heatmap. I used the seaborn library to create a much quicker (pixel based) map.
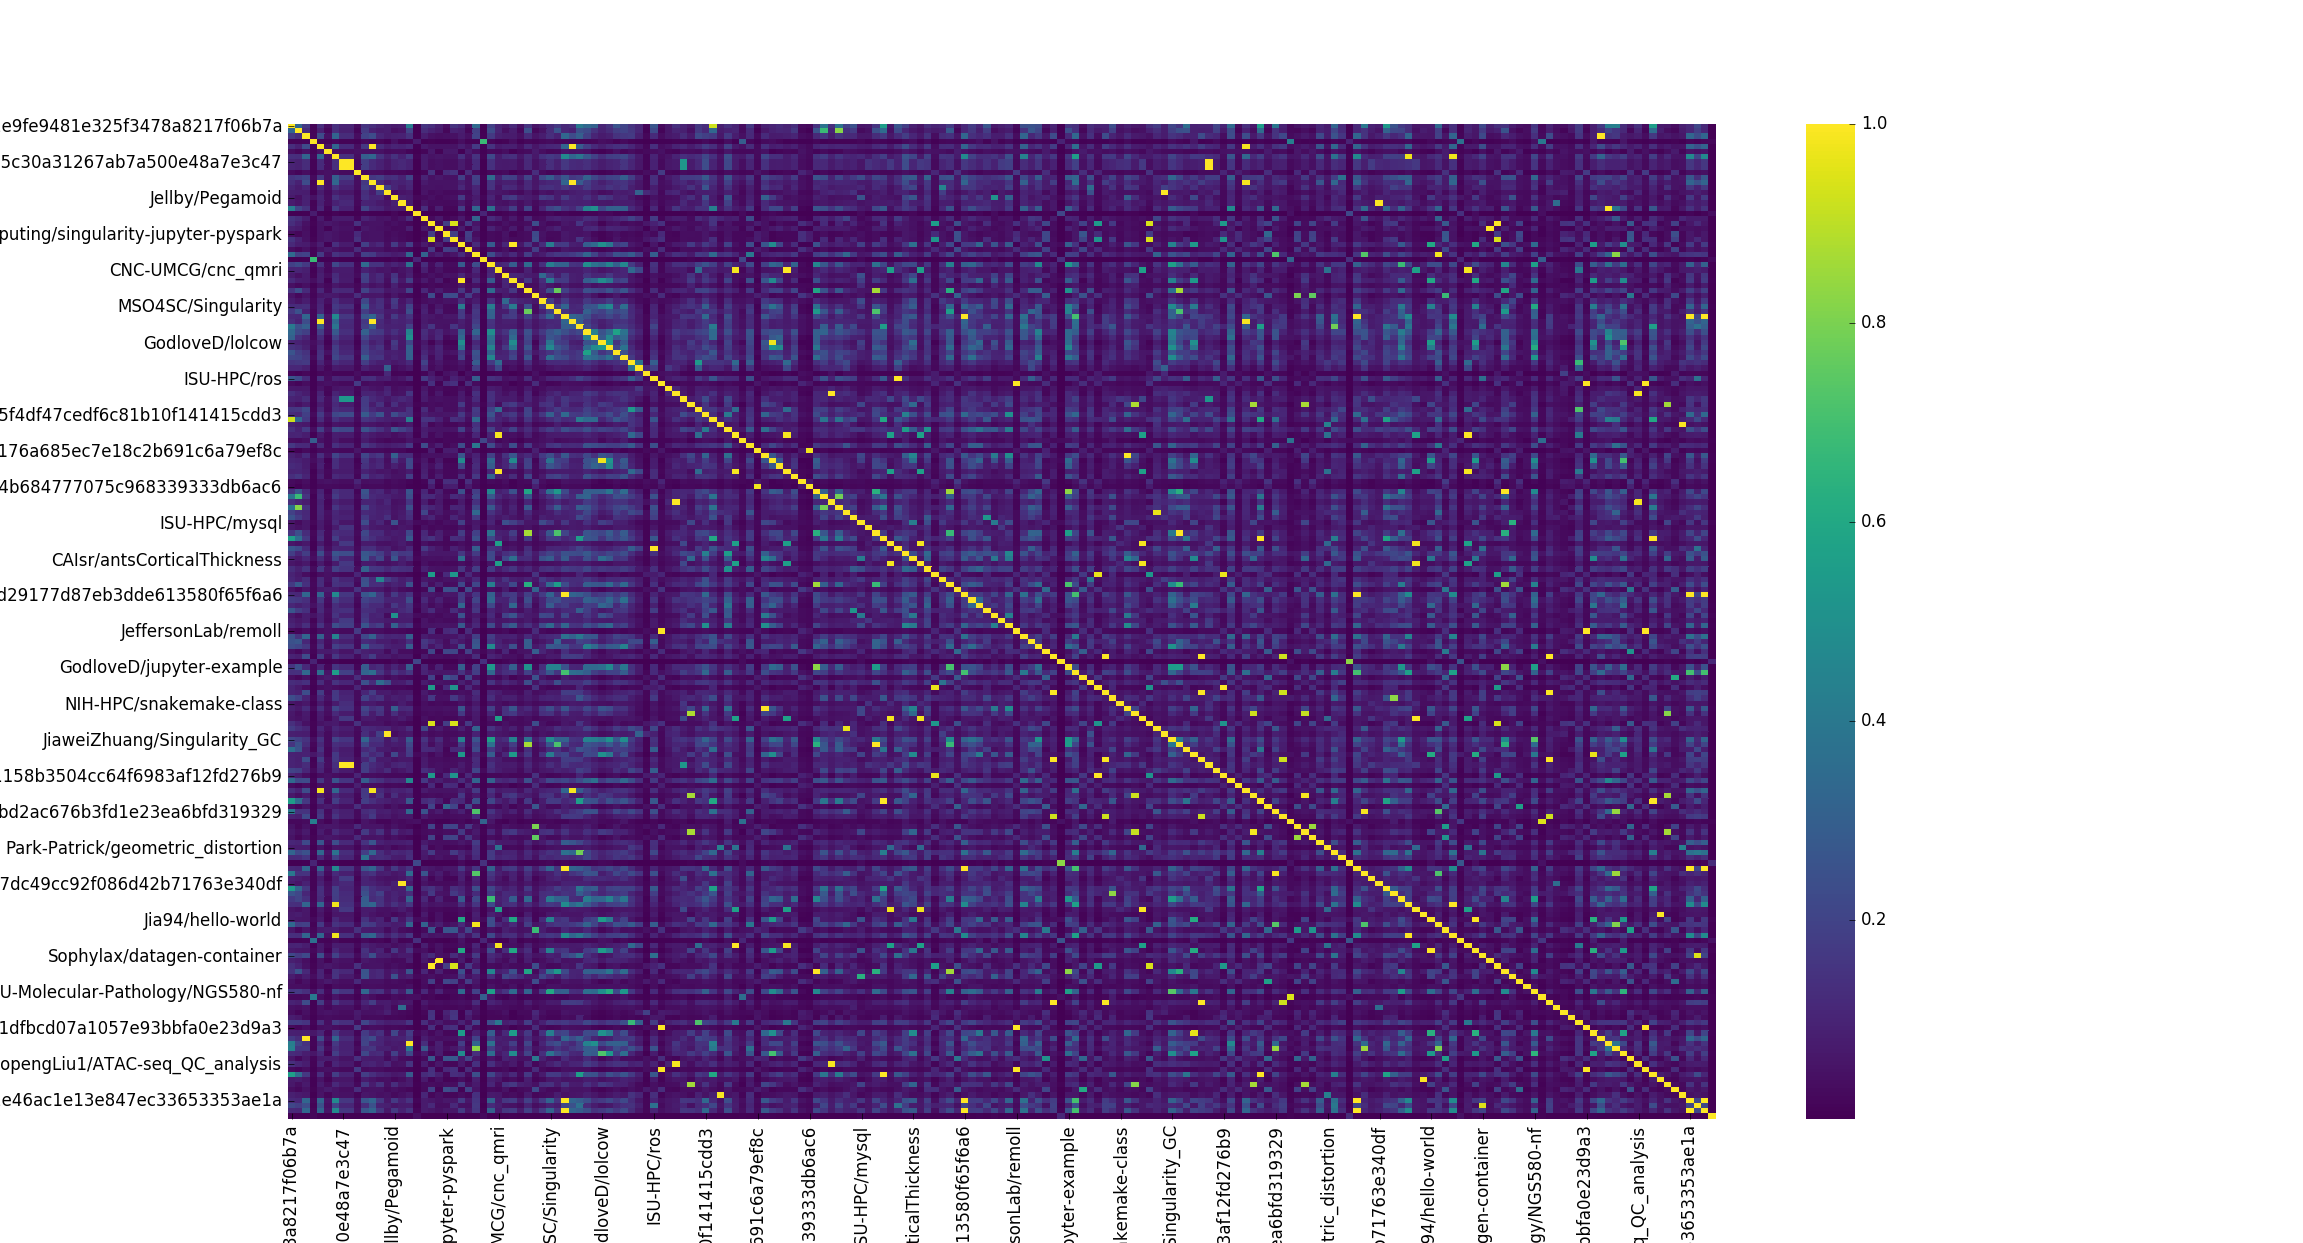
This is still not meaningful. The only sanity check I get here is that when I compare a container to itself (the diagonal) it’s exactly the same (yellow). This is the kind of plot that you show your Mom (or other relative) to impress her that “you do data science” and “whoa there are like, squares and colors and this must be important!” When I started graduate school I was really impressed by these kind of plots, along with any kind of clustered force layout (gephi I’m looking at you!) until I realized that they all look the same and whenever I saw them in papers, it generally felt more like an effort to impress than to think hard about giving the reader a meaningful visualization. It also was somewhat bothersome that you could sit there in the gephi editor and tweak forces to get whatever kind of plot you wanted. My bullshit detector started going off when I saw these plots, and I have stayed away from them in favor of almost anything else.
Part 3: Discussion
It’s time for some dinosaur discussion. I did wind up generating a plot that I thought was slightly better than the first (failed) attempts. Here it is.
We can actually read the labels, and see groups of highly similar containers. It’s not surprising that the lolcow and it’s similar installer are almost the same, or that two different users that implemented jupyter containers got similar results. Beyond that, the plot isn’t very interesting. But here’s the thing. In generating this picture, there is so much that you don’t know. Did you realize that the number of containers went from 193 down to 26? This is because I explicitly decided to filter equivalent (but different versioned) containers, and then again filtered to not include containers that were (on average) not similar to any other containers. Could that be the most interesting thing about the container set? Yes it could be! And I removed them! Or what if we just looked at differences for the same container?
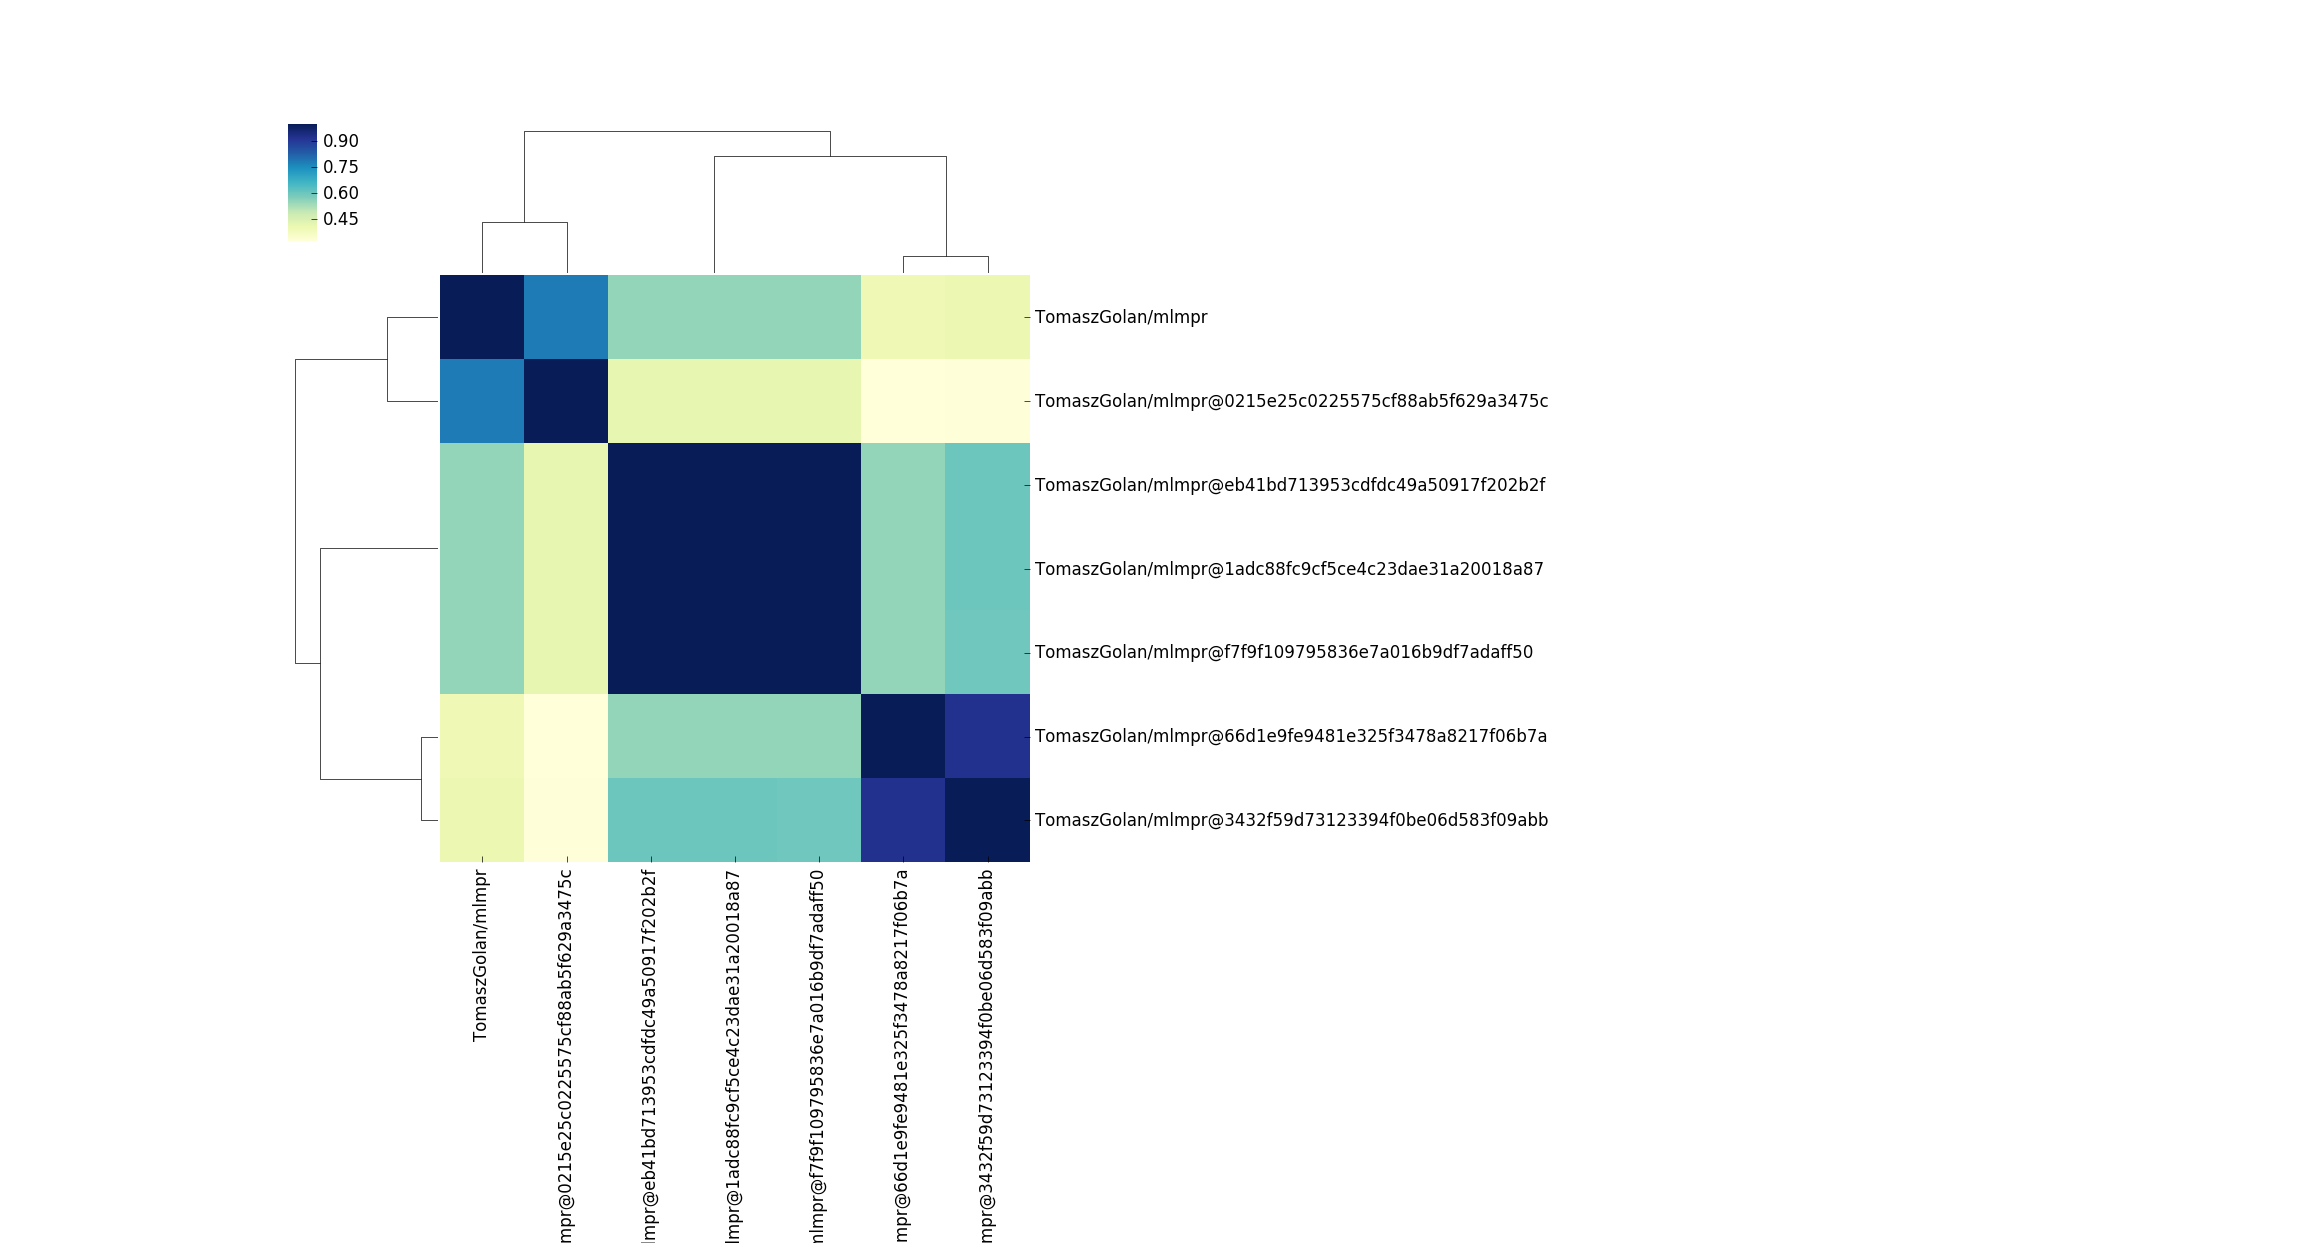
This is another interesting story! I honestly didn’t expect a few versions of (what I thought was the same container) to look so different. The above container on Singularith Hub has different versions of caffe, and varying implementations of py/cuda. What must be the case to see such differences? Based on just this plot, I would guess that adding cuda added a crapton of files. Actually, if you look at the sizes between these containers, this does look like the case - there is an increase in ~1000MB for the container size. I should also add that the design of Singularity Hub biases to have containers in collections that are different like this. If you rebuild a container (with the same tag) it will update the tag (and replace the previous version) so the only different “versions” we see here are for different tags, and this might be something I need to better reflect in the container API. But what could be a next logical question? How do these containers compare with respect to resource usage or production of some output?
Once armed with a question like this (that is actually useful, note that I’m not good at coming up with useful questions to ask, hence why I build stuff) you could create beautiful visualizations to explore your findings. For example, you could imagine running an analysis across these slightly different versions of the “same” container, and then having each cell of the heatmap link to a file hierarchy plot to show the file and folder differences. You could then tag the nodes with hashes of the files, and use the comparison metric to calculate differences not just on file and folder presence, but on their versions. You could even use the container recipes as interesting features - how do changes in the recipes lead to differences in the filesystems? With enough data, you could probably make some sort of general abstraction between a recipe, a filesystem, and then an outcome of interest (AI generated operating systems, anyone?)
For a very logical progression the viewer would be presented with a heatmap portal that could be easily explored to go from the highest level (the heatmap) down to the version of a file fairly quickly. That is SO cool. Now if only I had someone with an interesting research question and a container in mind that would want to work on this with me? hint hint.
Summary
Visualization
I’ll stop here for now and summarize what I learned, because in this journey I learned some important things. Notably, that I can aspire to provide automated functions to get very far with data analysis, but at the end of the day some human expertise is (usually) needed to make decisions about what is important to highlight in the final plot. The automated algorithm would be happy to show everything, but everything isn’t so meaningful. A visualization is rarely unbiased, it has come to be after much filtering and (hopefully careful) decision making done by the creator. There are elements that might have been interesting that are completely removed from the visualization. You might ask yourself when you look at a plot “What was removed here?” before inspecting what wasn’t. You might question your own decision about what you removed, because maybe it was interesting and you didn’t look at it in the right way. At the end of the day, however, the human element is (still) largely needed to produce a final visualization that is functional meaningful.
I also learned that visualizing large data in a browser (with the standard DOM) is still pretty hard, and we need libraries that use pixels / WebGL to do better. I haven’t worked in this domain for a while, so I might want to play around in it again at some point.
Comparison
Importantly, I don’t mean to say that this one (rather limited) way of comparing containers is the best or even correct way to compare containers. For example, the same software installed in two different locations would be identified as different. This would mean you could have two containers that produce the exact same result, but have entirely different scores. This would be very misleading indeed, and I’ll say that this simple comparison of filesystems approach, given that we generate and install based on package managers and what not, I believe to be a reasonable start in the domain of work for container comparison. I am doing this work (with dummy examples) to provide for you the start of data structures and functions for you to develop your own algorithms. I also want to inspire you to think about container comparisons, and how you might do them. Could you generate a tree that keeps the file hash at each node, and then identify similar containers based on matching files, and use a graph distance metric to measure distance in the file hierarchy? Might you instead compare containers based on a functional difference because after all, the function is what we care about? Could you combine both structure and function into a meaningful algorithm? (This is starting to feel eerily like we are asking similar questions that we asked years ago during our early study of the brain. Structure? Function? Both?
MooMoo, MotherTruckers
Oh, and the last thing we learned today…
the lolcow is still the center of my container universe!
because my visualization says so. QED!
Why are these Exciting Times?
We can dive even deeper into our kinds of comparisons. For example, if you write a program to print “Hello World” in multiple languages (ahem) you will produce the same output running the program (“Hello World!”) but if you run a trace, will see very different things happening on the level of the operating system. If we want to optimize not only function but also structure, we must take into account structure and function on the lowest level, and so a next logical step would be to assess how our programs are different on this lowest level. We might find something surprising like we can break down most things into routines of reads and writes in different patterns that are present across what (appear to be) very different software.
One thing that I find really exciting is that the incentive landscape is changing quite quickly. We haven’t yet in history had a point in time when these subtle (system level) differences have been important enough for an academic researcher to get funding for to write papers on. These are the sorts of questions that historically a graduate student might bring to his or her PI (studying the differences in software or libraries) and get a “So what?” kind of answer. They would never be funded or labeled as interesting. But now that data / infrastructure / everything is getting huge, and people want (and need) more optimized resources (GPUs! containers! clusters!) and what not, people are starting to care. They care because they have to, because the thing they want to accomplish possibly isn’t even possible if they cannot.
This is exciting because the time will be soon (I think) for analyses like these that 5 years ago weren’t impendingly important to finally be noticed. We are also entering this weird “AI does everything” state of the world, and it’s only logical that we soon will have operating systems / software designed by algorithms. Algorithms need something to train from, features and metrics of goodness, and it’s usually the case that the first go at features come from the human hand before they are optimized (derived in an unsupervised fashion) by a machine.
Finally, I’ll add that containers have a huge role in this new kind of operating system science and AI. With containers, we can spin up an entire OS with one line, make a change, and then do it again. Just like modifying genetic code, we can tweak our software, see if the resulting organism container survives, and blow it up and try again if it doesn’t. We can do it at scale. I would expect (and hope) to see grid-style analyses where an entire operating system is built with varying perhaps just one feature, and then assessing how the variance leads to some variable of interest in using the container. Research projects with specific purposes should have their infrastructure optimized for them. Containers, for the win! :D
Your Job!
I want you to have fun! Tell me what other functions you are interested in? Remember that the examples and their generation are provided in each of the subfolders of the examples directory. You can use/install and contribute to containertree by following the instructions in the README.md, and open an issue on the issues board there if you run into any.
On the queue I am going to next work on 1) similar data structures that will use the container-diff output of packages (here is an example) and 2) possibly something with a scatterplot, because I like them and 3) I might try some basic machine learning stuffs on these files and packages, but I’m not decided on that yet. What do you think this would look like? And what ca we do next? Would we want to know what files or packages change between versions of a container? What questions do you want to ask? If you want to do some sort of mini analysis with me, please reach out! I’ll quickly add that if you do have a research question in mind and want someone to drive the work, please reach out and I’ll make it happen :) Working on projects with friends is fun. :)
Suggested Citation:
Sochat, Vanessa. "Container Trees." @vsoch (blog), 23 May 2018, https://vsoch.github.io/2018/container-tree/ (accessed 14 Jul 26).