In spirit of last month’s Tributors library to make it easy to honor your contributors in a GitHub repository, this weekend I wanted to add a GitHub style contributions graph to a Django application. Although I wound up not using it for the app, I realized that it would be a great opportunity to make it easy to do next time - meaning that I wanted to create a Django module proper that could easily generate the plot from a list of timestamps. This let to the quick morning project, contributions-django, that provide a module and example app for easily adding a GitHub style contributions graph.
Show me the Graphs!
If you enter an empty list (of timestamps), you’ll get an empty graph. Akin to how GitHub does it, it’s for the past year. Also notice that the mouseover shows the number of contributions for the day:
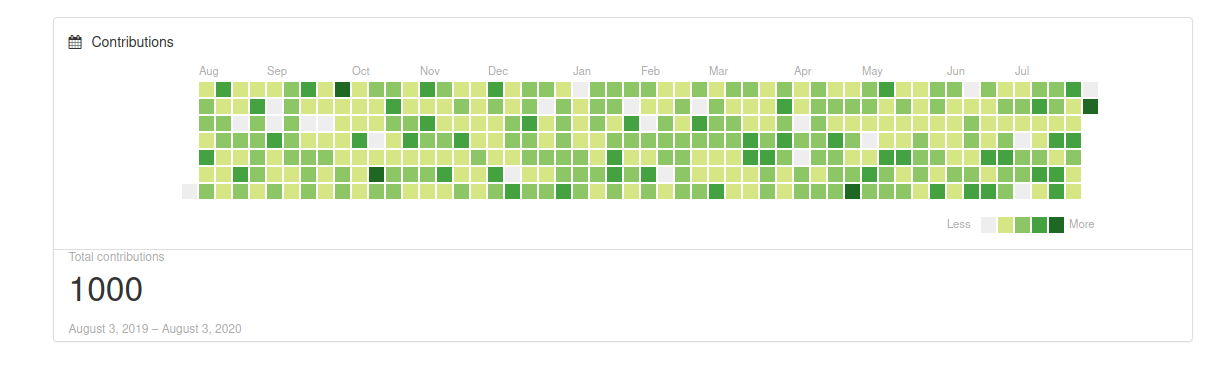
Once you add a list of event timestamps (naive or aware in Django) the graph will populate!
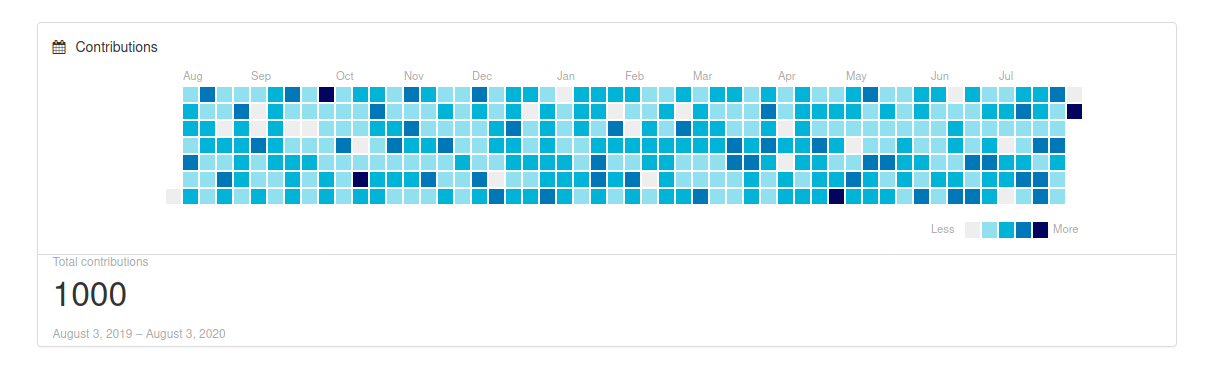
You can also customize the color to your liking! I tried out blues:
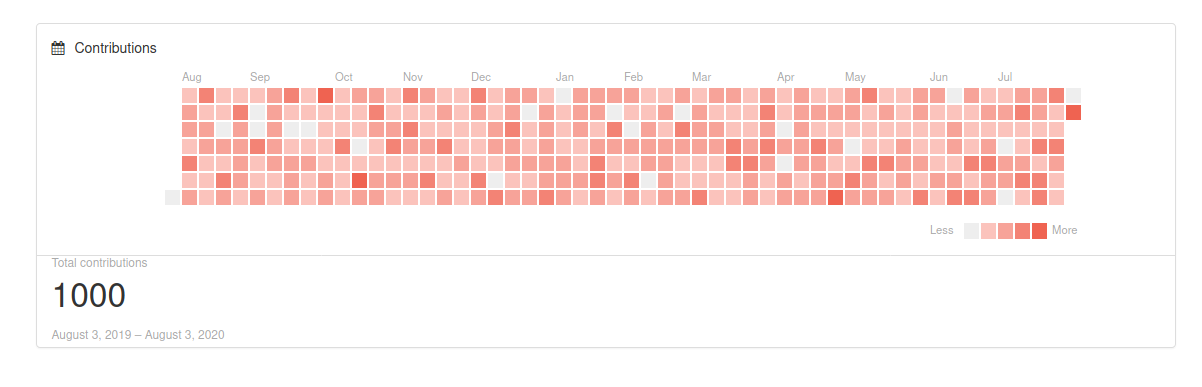
and pinks!
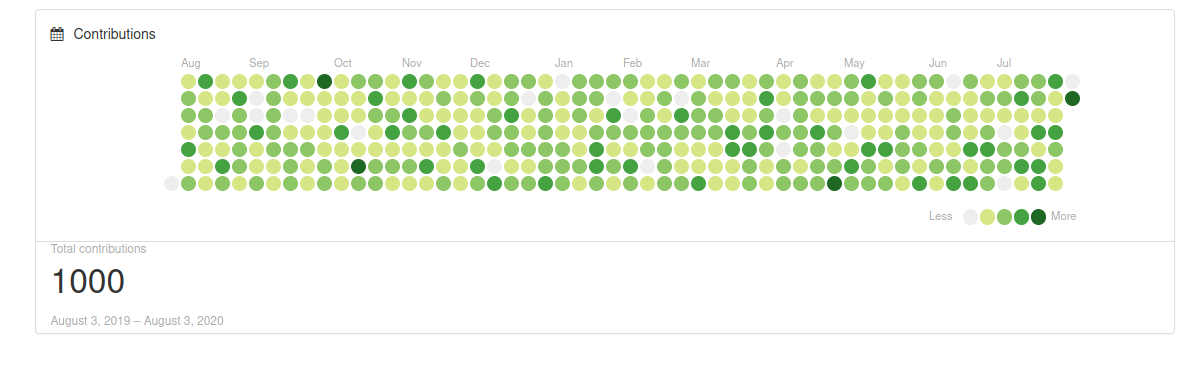
and for any color, you can also make the cells circular:
How does it work?
Without getting into the underlying generation of the plot, I’ll show you how to use it for your Django application. And if you want to start with code, I’ve created an example application. The first thing you’d want to do is install the library, likely from pip (although you are free to install from the repository):
pip install contributions-django
Then add it to your INSTALLED_APPS:
INSTALLED_APPS = (
    ...
    'contributions_django',
    ...
)
To generate the graph in on of your views, your should import generate_contributors_graph. The function is simple - it
takes a list of dates (naive or aware) and an optional title. That will produce a context with a contributions_django
namespace that has all the metadata for the view:
# This is an example model that has a date attribute
from .models import Event

from django_contributions.graphs import generate_contributors_graph
from django.shortcuts import render

def events_view(request):
    """Generate a papers graph using all Events dates
    """
    # Get a single list of timestamps for the view
    dates = Event.objects.values_list('date', flat=True)
    context = generate_contributors_graph(dates, title="Contributions")
    return render(request, "events/index.html", context)
And then in your template, include this snippet where you want the graph to show:
{% include "contributions_django/graph.html" %}
Note that by default, the template includes bootstrap style (css) and font awesome icons, and the color is a gradient of greens. These variables, along with other settings, can be customized (discussed next).
Customization
If you want to customize any colors or text in the graph, you can do that in your
settings in a CONTRIBUTIONS_DJANGO section - a basic setup with green circles
is shown below:
CONTRIBUTIONS_DJANGO = {

    # Gradients (0 or weak to stronger)
    'GRADIENT0': "#eee",
    'GRADIENT1': "#d6e685",
    'GRADIENT2': "#8cc665",
    'GRADIENT3': "#44a340",
    'GRADIENT4': "#1e6823",

    # The name to appear in tooltips (e.g., 12 contributions)
    'ITEM_NAME': 'contributions',

    # Include bootstrap style for outer part of template
    # set this to false if you already have it on your page
    'INCLUDE_BOOTSTRAP': True,
    'INCLUDE_FONTAWESOME': True,

    # The icon to show next to title. Set to None to remove.
    'ICON_CLASSES': "fa fa-calendar",

    # circular cells instead of squares
    'CIRCLES': True
}
If you want to see any other customizations please let me know!
Colors
For gradients, you can find a color palette generation site like this one
and customize gradients 1 through 4. You likely don’t want to customize GRADIENT0 since
that is the grey (empty) color. The default (akin to GitHub) is a set of greens.
Here is the settings for a blue (shown at the top):
# Gradients (0 or weak to stronger)
'GRADIENT0': "#eee", # this is empty gray, likely don't want to change this
'GRADIENT1': "#90E0EF",
'GRADIENT2': "#00B4D8",
'GRADIENT3': "#0077B6",
'GRADIENT4': "#03045E", # this should be the darkest
And pinks (also shown at the top)!
# Gradients (0 or weak to stronger) - below is green
'GRADIENT0': "#eee", # this is empty gray, likely don't want to change this
'GRADIENT1': "#fbc3bc",
'GRADIENT2': "#f7a399",
'GRADIENT3': "#f38375",
'GRADIENT4': "#ef6351", # this should be the darkest
Please open a pull request to add examples of your favorite palettes!
Template
If you want to customize the entire template, then you can create a copy of the default and include it in your view instead.
{% include "example/mygraph.html" %}
Dates
Importantly, with Django it’s recommended to not use naive datetimes. In fact, you’ll get an error if you try saving a naive datetime to a model field. This means that contributions_django must be flexible to accept naive or aware times. Here is how you can generate timestamps that are aware:
from datetime import timedelta
from django.utils import timezone
import pytz

# get today and one year earlier
today = timezone.now()
last_year = today - timedelta(days=365)

# Create an event with a timezone aware timestamp
Event.objects.create(date=last_year, name="My Event")
And here is a naive timestamp:
from datetime import datetime
timestamp = datetime.now()
Regardless of your choice, the contributions graph only cares about the day,
so it takes the timestamp.date() that is available regardless of being naive
or not.
Many Thanks
Thanks to the cookiecutter-djangopackage library that made it fairly easy to spin up the start for a django module without needing to start from scratch. And huge thanks to alexwlchan, who created the (now archived) repository contributions-graph that I was able to start with and refactor for Django. If anyone is interested in a standalone library for generating graphics (outside of Django) let me know and we can pick up a new project!
How do I contribute?
Please give the library a shot, and open an issu The library is very new, so I expect a lot of feature requests or bugs otherwise! Please take it for a spin, and report all that you like, dislike, and find. Thanks!
Suggested Citation:
Sochat, Vanessa. "Contribution Graphs for Django." @vsoch (blog), 03 Aug 2020, https://vsoch.github.io/2020/contributions-django/ (accessed 14 Jul 26).