I’ve always been really interested in the “meta” level of software development. How do developers work together on GitHub? How do libraries change over time? Can we find software that has historically been mentioned in a paper if it wasn’t cited? While I have never had a position that warrants looking at these questions, this doesn’t stop me from embarking on fun related projects that might spawn interest or otherwise reflect on these questions. This is exactly what I started over Christmas break:
a library called caliper that would be the start to asking some of these questions. I don’t have any answers yet, but in this post I hope to share some ideas and tools that might get us started on this kind of analysis.
What is Caliper?
Caliper is is a tool for measuring and assessing change in packages. The idea is simple - given that we might measure some unit of change or a metric for a single version, we could then use this data to understand (or even predict) when something is likely to break. We can look for patterns in development (for example, how different are versions actually)? We can analyze one or more scripts against different Python and package versions to assess how reproducible the script is, or just what versions are supported. Caliper is a tool that gives you a base for starting to ask these kinds of questions. In this post, I’ll review a few possible use cases for such a tool.
- Creating a ground truth that might be used in a supervised ML framework
- Measuring change or a metric for understanding, or for use as a feature in the same framework
- Sharing metrics to support any kind of community effort.
How do we create a ground truth?
Imagine that we discover a repository in the wild. It uses tensorflow, but has absolutely no versions. How might we know what version(s) would work? Well, the simplest answer if we don’t have any ideas is to use brute force. The only thing better than some kind of static analysis is actually running the script given some version of Python and the module and seeing the error message. This is the purpose of caliper analyze.
1. Define your analysis
To start an analysis, you will have some number of scripts with a module of interest that you want to run,
and a range of versions for the module and/or python. You can represent these preferences in a configuration file, a file
caliper.yml, that defines paths to scripts that you want to test and other variables:
analysis:
  name: Testing tensorflow
  packagemanager: pypi
  dockerfile: Dockerfile
  dependency: tensorflow
  versions:
    - 0.0.11
  python_versions:
    - cp27
  tests:
    - tensorflow_v0.11/5_MultiGPU/multigpu_basics.py
    - tensorflow_v0.11/1_Introduction/basic_operations.py
    - tensorflow_v0.11/1_Introduction/helloworld.py
    - tensorflow_v0.11/4_Utils/tensorboard_advanced.py
...
In the above, note that we are telling caliper to use Pypi as the package manager, the file “Dockerfile” as a template to build our base container for installing and running tests, and then doing it under a particular number of python and tensorflow versions. The list of tests correspond to files that will be added to the container and run, and for each and output, error, and return value collected. We will also record if the container doesn’t successfully build, period. The Dockerfile is a jinja2 template that is populated to choose a base container based on the Python version, and then install the particular version of the library from the package manager. Extra user variables can be added if needed, meaning that you are free to create a base that fits your needs.
2. Run your analysis
Once we have the “caliper.yml” file and the “Dockerfile” above,
running the analysis is simple. You use the caliper command line client, and you can
either target a custom caliper.yaml file, or use one in the present working directory:
# present working directory
$ caliper analyze

# custom file
$ caliper analyze --config examples/analyze/caliper.yaml
3. Explore your results
Running the analysis will generate a .caliper/data folder with your results, which then
can be parsed into an interactive plot
using these scripts.
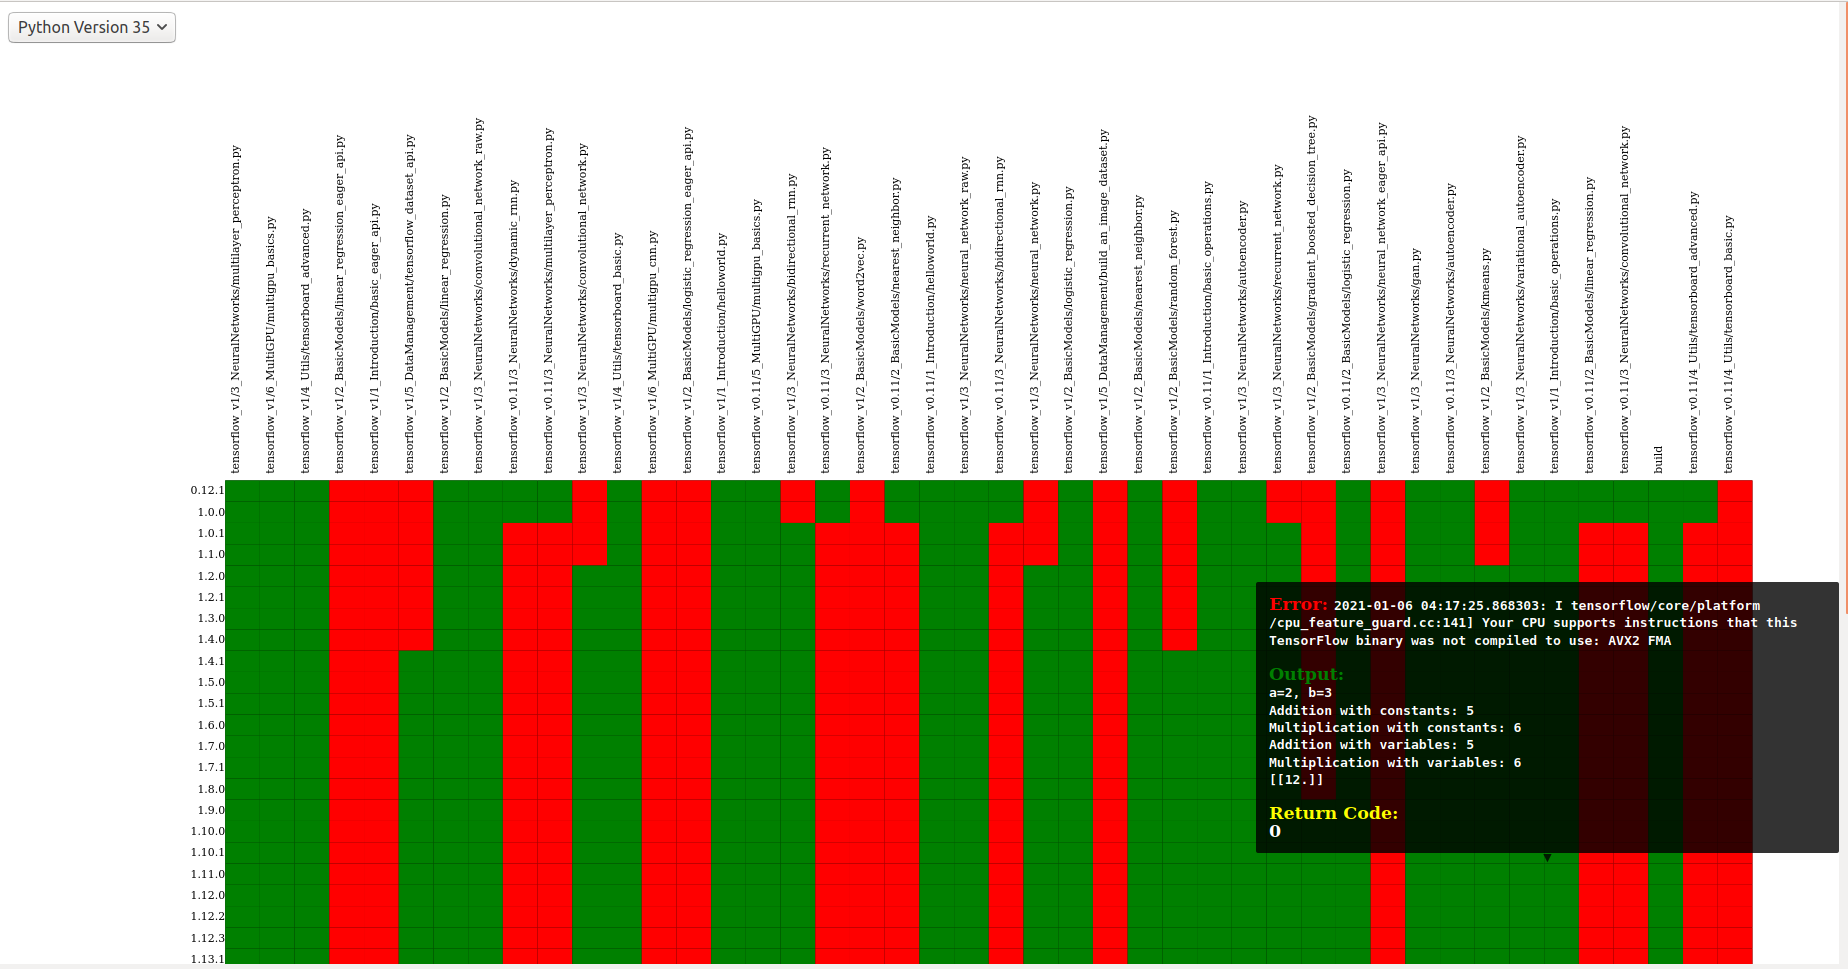
This plot shows versions of the library (tensorflow) on the Y axis, and tests on the X axis. The tests are example scripts that demonstrate core functionalities of tensorflow, which I converted into a small analysis repository. This is really interesting to look at - Red indicates an error, Green is a successful run, and black indicates that the container was not buildable and thus there was no test run. If you mouse over any cell, you’ll see the output, error, and return code. It’s interesting to see that the scripts start to break with later versions of Python, and if we look closer at errored cells in red, we can start to understand why they failed. For tensorflow, I know for a fact that the contrib and tutorials folders were moved elsewhere, so it’s validating to see these errors show up during these tests. I suspect it would be interesting to try and summarize the reasons! But overall, you can see how this data can provide a ground truth for some kind of analysis, as it gives you the actual result of running a particular version of Python and a library. I find it fun to explore without having any real end goal in mind.
How do we measure change?
Okay great - so we have a base dataset for knowing exactly when something works, and when it does not. What kind of data might we want to use to predict this? This is where caliper metrics come in, and extraction of metrics is indeed one of the core functionalities of caliper. These metrics can do everything from assessing changes to calculating some metric for a given version.
Changes in Code Organization
For example, using the “functiondb” metric, a metric that extracts a lookup of functions and classes for each release of a library, I was able to look at similarity of releases for a package, such as for pandas:
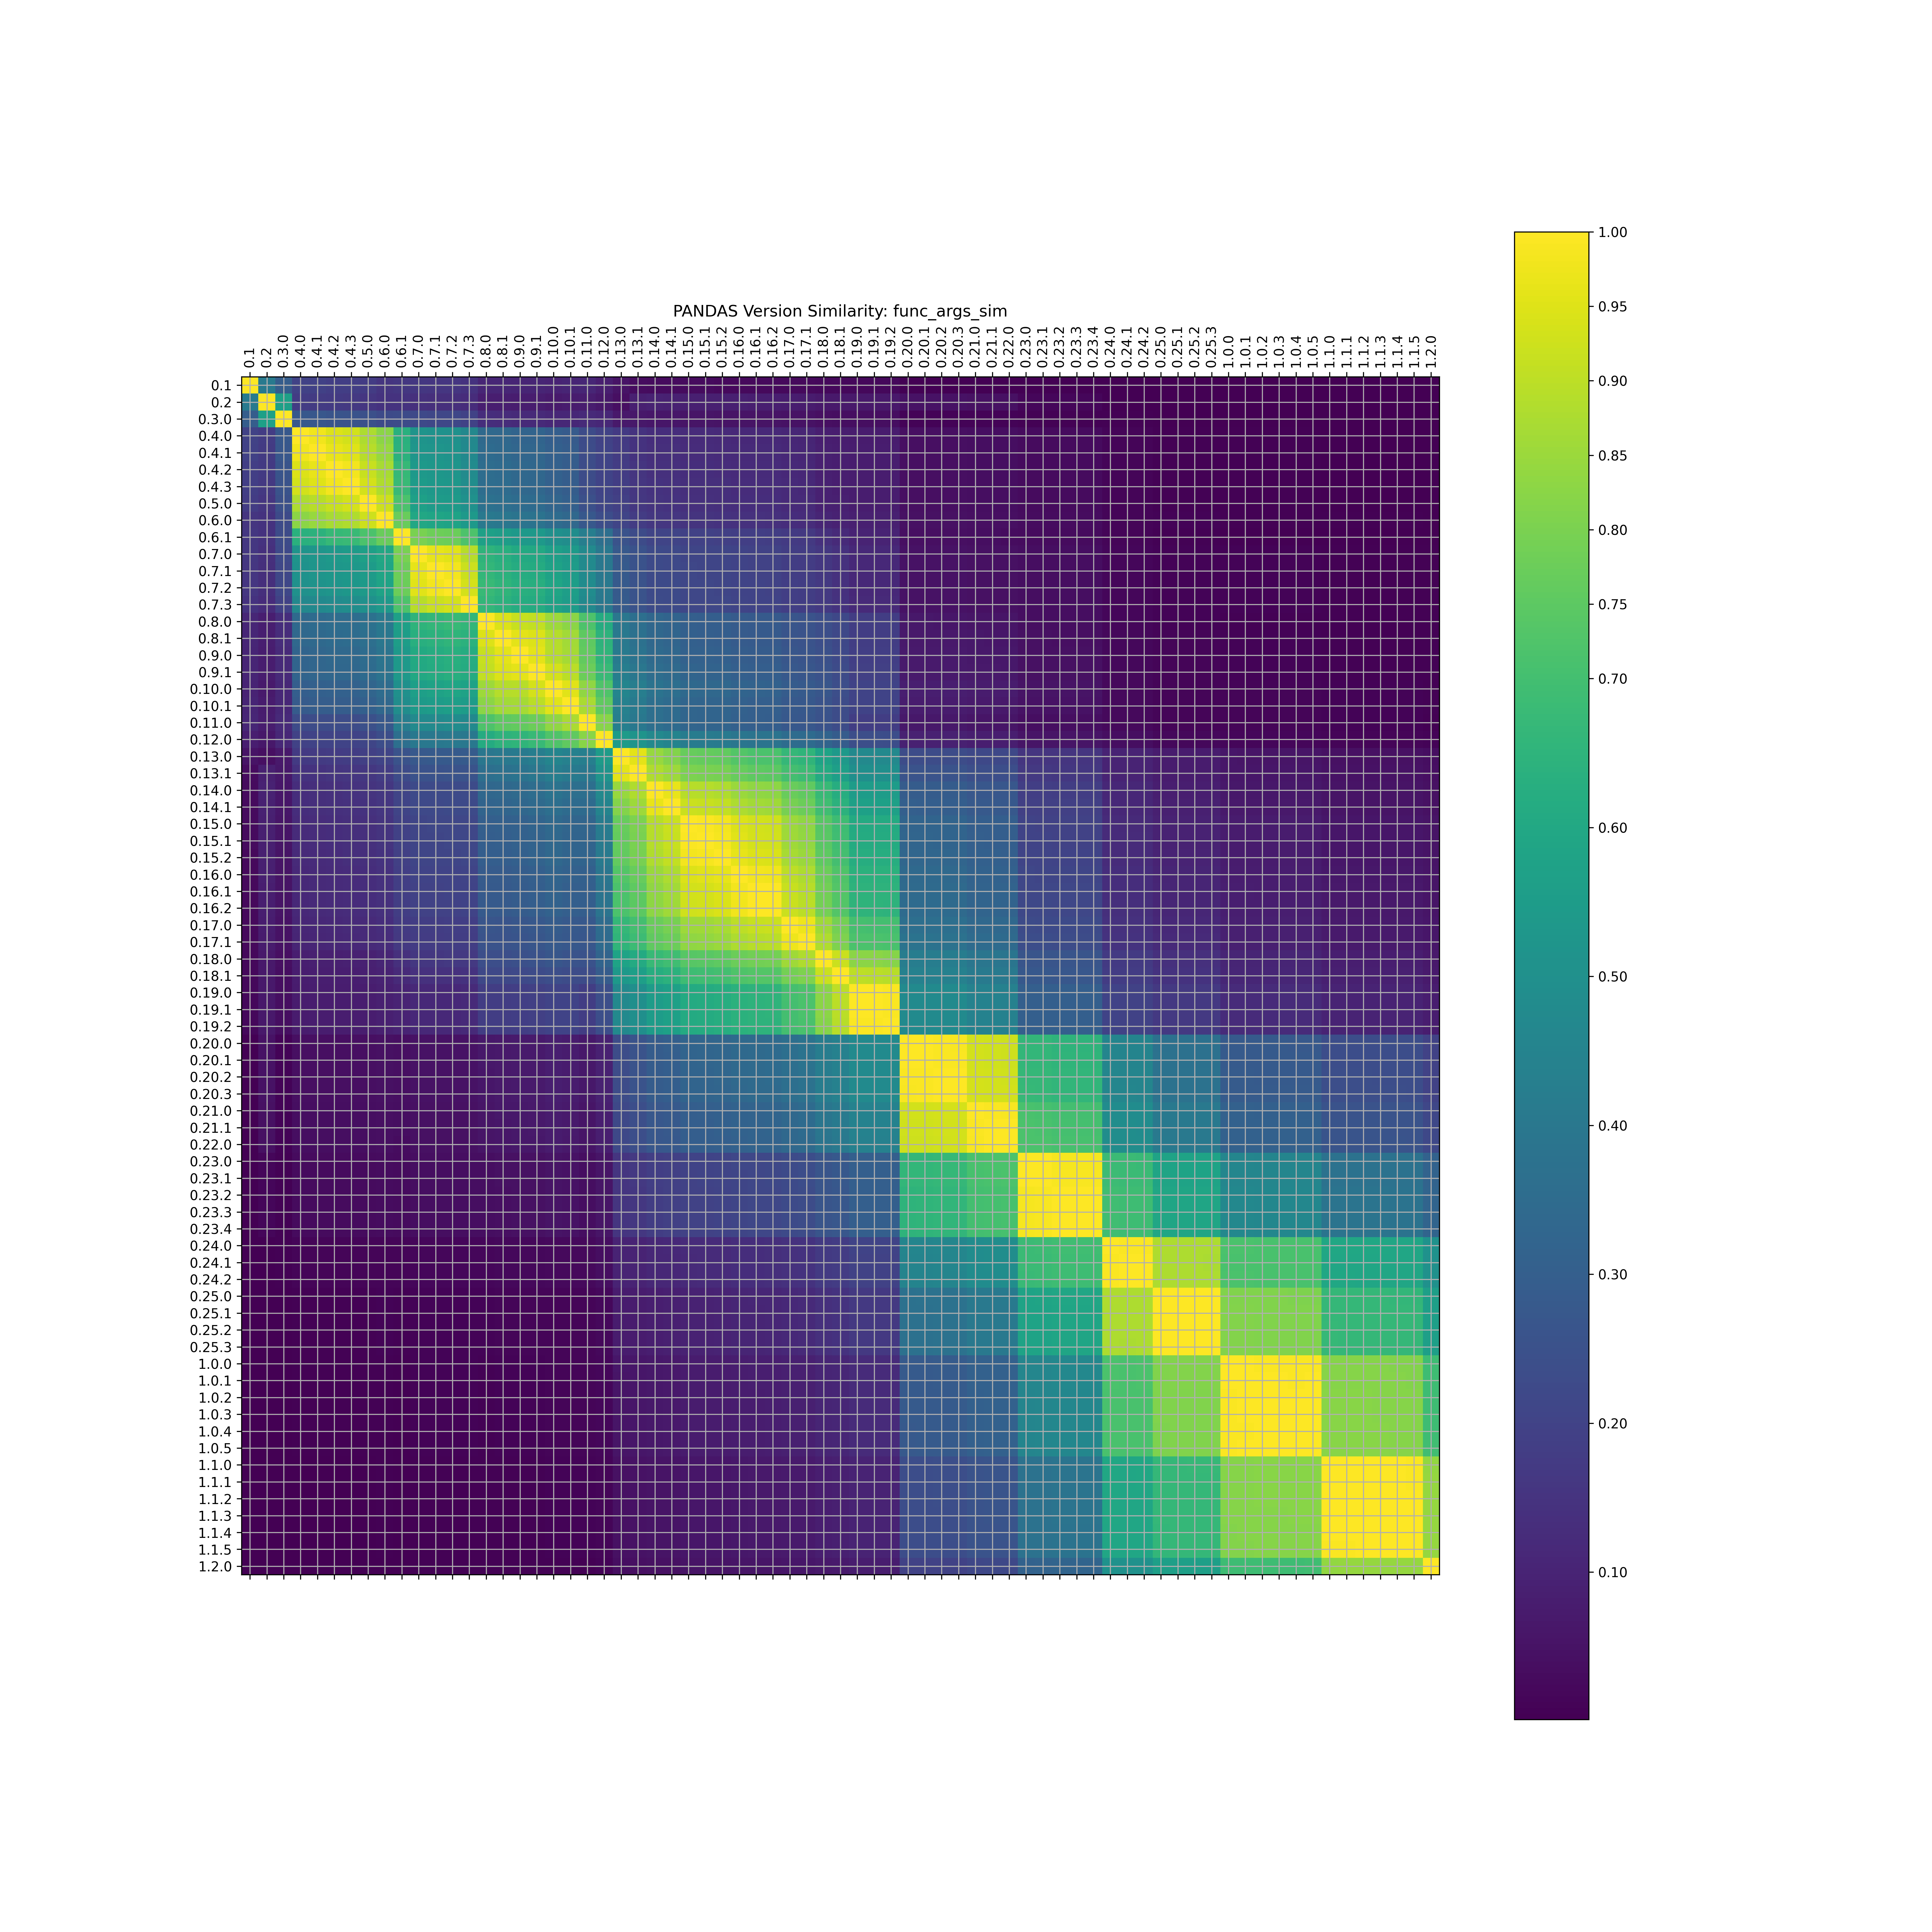
I calculated similarity for many libraries, and looked at similarity of modules, modules and functions, and modules, functions, and function arguments (in order of increasing detail). This could be useful, for example, to see that a large change in a library corresponds with a test not working for an analysis. The code for this is also available in the caliper-analysis repository, and there are a ton of plots to explore in the plots folder.
Changes in Git
Another obvious thing to look at is with respect to changes, as assessed by a GitHub repository. Caliper extracts any kind of metric by way of creating a version repository, or a repository that has every version available to checkout as a branch. This also means that we can take advantage of git and look at additions and general changes. For example, here is the “changedlines” metric for spack:
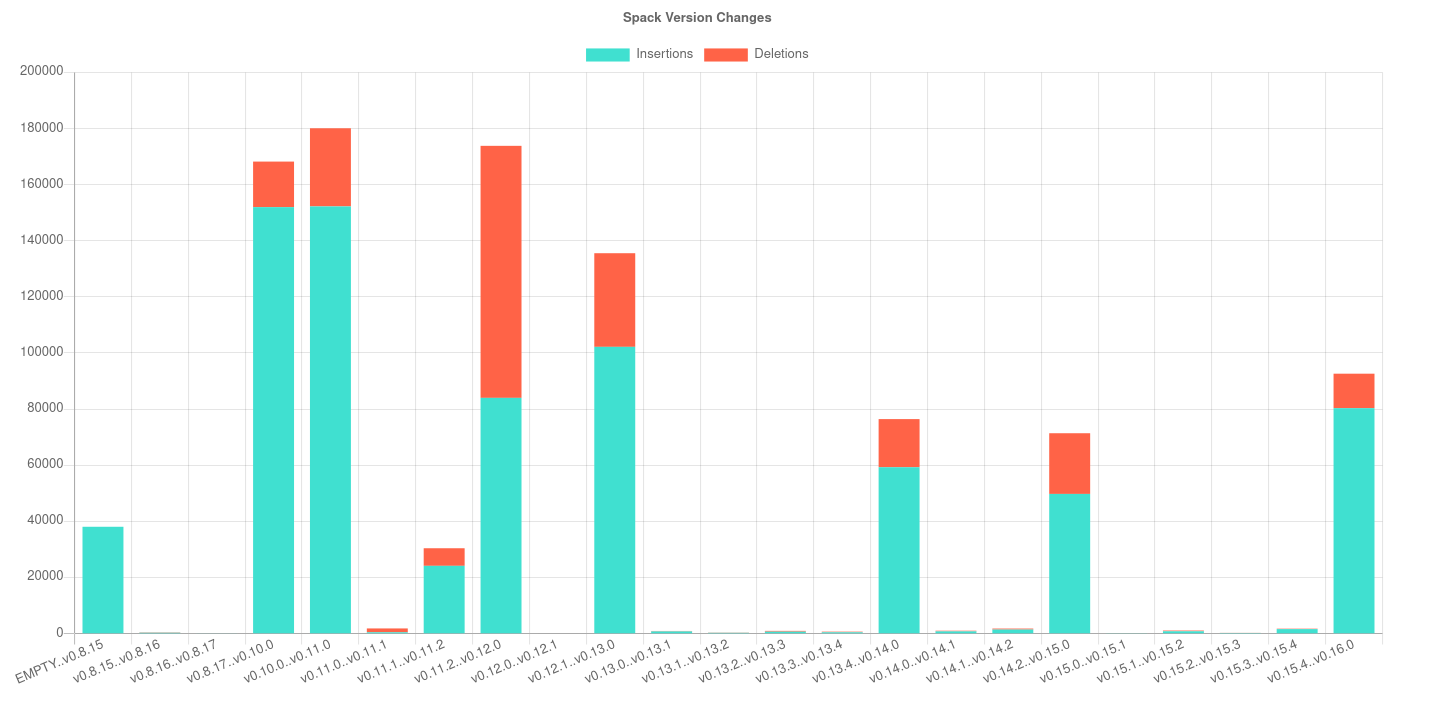
Not surprisingly, we see many more changes for major version releases than minor. For example, take a look at the bump from 11.x to 12 - there are a huge number of deletions! This is another metric that might be used to predict when something breaks, or to validate some practice or expectation like “The major bumps should correspond with overall larger changes to the library.” You’ll also notice that the bars are in reference to a range of versions! This is what caliper calls a change metric. The base class provides two commits to the metric extractor as opposed to one (which would be used for just one timepoint). To generate the data and produce the plot for it, we might do:
$ caliper extract --metric changedlines github/spack/spack
$ caliper view changedlines-results.json --title "Spack Version Changes"
and you can read more about extraction here.
How do we share our measurements?
I didn’t think it was good enough to extract these metrics on my local machine and call it a day. I also felt very lazy about keeping things up to date once I decided to extract. You can imagine that new versions are released over time (meaning we would have more extractions to do), and then you’d want to share the data. Toward this aim, I created a caliper-metrics repository, which will regularly run an update command to check for new versions of a library.
$ caliper update
The cool thing is that if you create a metrics extractor locally and want to load a particular library, if it’s in this metrics database repository it will programmatically download from the repository!
from caliper.metrics import MetricsExtractor
extractor = MetricsExtractor("pypi:tensorflow")
db = extractor.load_metric("functiondb")
And you can also create (and target) your own metrics database, including your own libraries and/or metrics. In the above, “db” is the compiled and loaded result - a function lookup for tensorflow that is downloaded from the repository. This would make it a lot easier to share some data if you choose to provide it.
Why Should I Care?
I probably made this project more for myself than any other reason. It was one of those itches that absolutely needed to be scratched, and I want to be ready, if the opportunity arises, to study software development. I want to see and understand how things change. The cool thing about caliper is that it’s a relatively general tool that empowers you to study many different kinds of packages (e.g., the examples here used pypi and GitHub but you can easily add another manager to the library) and any kind of metric that you can code up. If you’d like to take a look, take a look at the Getting Started guide. If you want to contribute a metric or manager, this is even better! And if caliper or the ideas within are useful to you, please cite the repository via it’s Zenodo DOI.
![]()
Suggested Citation:
Sochat, Vanessa. "Caliper: Understanding Changes in Software." @vsoch (blog), 22 Jan 2021, https://vsoch.github.io/2021/caliper/ (accessed 14 Jul 26).