I got my second vaccine today and arrived home after the end of the work day, so I decided to treat myself to a little fun and finish up a small project I started over the weekend. It was a silly question - I wanted a means to assess the popularity of Spack packages. How do we measure the popularity of these spackages? What does it even mean to be popular?
Can we measure usage?
I first thought about usage. To measure this I would need to be some kind of actual admin on an HPC cluster and measure usage by way of jobs or some other metric. But that could also come with its own biases. I also couldn’t easily do that, so I decided to look at what I would call open source popularity.
Can we measure open source activity?
You can be pretty sure something is active (and thus popular) if people open issues about it. Those issues turn into pull requests, and those pull requests turn into commits. So while I can’t be sure that this is the only or best metric, I think I can say that this is one metric of package popularity. A package is popular if:
- The package has issues and pull requests opened for it
- The package has more commits over time
The reason that this is more of a developer oriented approach is because we aren’t actually measuring usage. We are measuring requests for updates or change, which I’d say is more likely to happen in packages that are used more frequently. But we could also see that the packages with the largest number of commits are the most complex ones. So assuming that this is OK to look at, the next question is how do we measure activity? While I could have used the GitHub API to look at commits and pull requests, I decided to stick with commits. It’s much easier to determine if a package is associated with a particular git commit as opposed to an issue or pull request. These three metrics are likely correlated anyway.
The Results
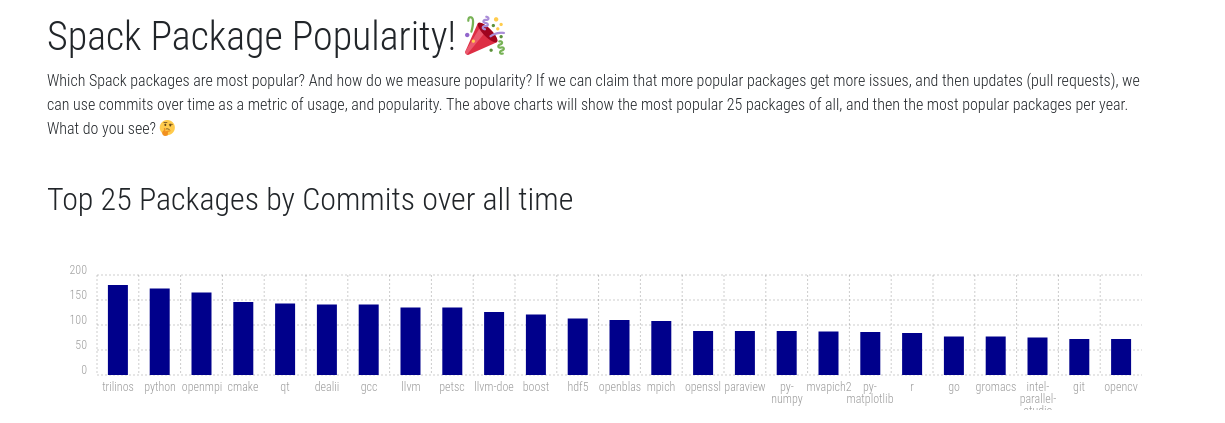
So what do we see? Take a look yourself!.

You can see the repository here for extraction details and data. I’ll note that there was a large re-organization of package files in 2013, so if the git log extraction is not done with “–follow” you might missed these renamed files. What do I think? I’m not entirely convinced that these plots show popularity - I think based on seeing the prevalence of openmpi, boost, and openblas, I would suspect these packages have more commits because they are more complicated, and thus have more issues. But seeing Python, and Python packages, and things like Paraview, does suggest that maybe there is a little reflection of usage in there. We would have to compare this with some kind of actual metric of usage to be sure.
Anyway, that was fun, thanks for listening!
Suggested Citation:
Sochat, Vanessa. "Package Popularity." @vsoch (blog), 03 May 2021, https://vsoch.github.io/2021/package-popularity/ (accessed 01 Jul 25).