How similar are my operating systems?
A question that has spun out of one of my projects that I suspect would be useful in many applications but hasn’t been fully explored is comparison of operating systems. If you think about it, for the last few decades we’ve generated many methods for comparing differences between files. We have md5 sums to make sure our downloads didn’t poop out, and command line tools to quickly look for differences. We now have to take this up a level, because our new level of operation isn’t on a single “file”, it’s on an entire operating system. It’s not just your Mom’s computer, it’s a container-based thing (e.g., Docker or Singularity for non sudo environments) that contains a base OS plus additional libraries and packages. And then there is the special sauce, the application or analysis that the container was birthed into existence to carry out. It’s not good enough to have “storagey places” to dump these containers, we need simple and consistent methods to computationally compare them, organize them, and let us explore them.
Similarity of images means comparing software
An entire understanding of an “image” (or more generally, a computer or operating system) comes down to the programs installed, and files included. Yes, there might be various environmental variables, but I would hypothesize that the environmental variables found in an image have a rather strong correlation with the software installed, and we would do pretty well to understand the guts of an image from the body without the electricity flowing through it. This would need to be tested, but not quite yet.
Thus, since we are working in Linux land, our problem is simplified to comparing file and folder paths. Using some software that I’ve been developing I am able to derive quickly lists of both of those things (for example, see here), and matter of fact, it’s not very hard to do the same thing with Docker (and I plan to do this en-masse soon).
Two levels of comparisons: within and between images
To start my thinking, I simplified this idea into two different comparisons. We can think of each file path like a list of sorted words. Comparing two images comes down to comparing these lists. The two comparisons we are interested in are:
- Comparing a single file path to a second path, within the same image, or from another image.
- Comparing an entire set of file paths (one image) to a (?different) set (a second image).
I see each of these mapping nicely to a different goal and level of detail. Comparing a single path is a finer operation that is going to be useful to have detailed understanding about differences between two images, and within one image it is going to let me optimize the comparison algorithm by first removing redundant paths. For example, take a look at the paths below:
      ./usr/include/moar/6model',
      ./usr/include/moar/6model/reprs'
We don’t really need the first one because it’s represented in the second one. However, if some Image 1 has the first but not the second (and we are doing a direct comparison of things) we would miss this overlap. Thus, since I’m early in developing these ideas, I’m just going to choose the slower, less efficient method of not filtering anything yet. So how are we comparing images anyway?
Three frameworks to start our thinking
Given that we are comparing lists of files and/or folders, we can approach this problem in three interesting ways:
- Each path is a feature thing. I’m just comparing sets of feature things.
- Each path is list of parent –> child relationships, and thus each set of paths is a graph. We are comparing graphs.
- Each path is a document, and the components of the path (folders to files) are words. The set of paths is a corpus, and I’m comparing different corpus.
Comparison of two images
I would argue that this is the first level of comparison, meaning the rougher, higher level comparison that asks “how similar are these two things, broadly?” In this framework, I want to think about the image paths like features, and so a similarity calculation can come down to comparing two sets of things, and I’ve made a function to do this. It comes down to a ratio between the things they have in common (intersect) over the entire set of things:
score = 2.0*len(`intersect`) / (len(`pkg1`)+len(`pkg2`))
I wasn’t sure if “the entire set of things” should include just folder paths, just files paths, or both, and so I decided to try all three approaches. As I mentioned previously, it also would need to be determined if we can further streamline this approach by filtering down the paths first. I started running this on my local machine, but then realized how slow and lame that was. I then put together some cluster scripts in a giffy, and the entire thing finished before I had finished the script to parse the result. Diabolical!
I haven’t had a chance to explore these comparisons in detail yet, but I’m really excited, because there is nice structure in the data. For example, here is the metric comparing images using both files and folders:
A shout out to plotly for the amazingly easy to use python API! Today was the first time I tried it, and I was very impressed how it just worked! I’m used to coding my own interactive visualizations from scratch, and this was really nice. :) I’m worried there is a hard limit on the number of free graphs I’m allowed to have, or maybe the number of views, and I feel a little squirmy about having it hosted on their server… :O
Why do we want to compare images?
Most “container storage” places don’t do a very good job of understanding the guts inside. If I think about Docker Hub, or Github, there are a ton of objects (scripts, containers, etc.) but the organization is largely manual with some search feature that is (programmatically) limited to the queries you can do. What we need is a totally automated, unsupervised way of categorizing and organizing these containers. I want to know if the image I just created is really similar to others, or if I could have chosen a better base image. This is why we need a graph, or a mapping of the landscape of images - first to understand what is out there, and then to help people find what they are looking for, and map what they are working on into the space. I just started this pretty recently, but here is the direction I’m going to stumble in.
Generating a rough graph of images
The first goal is to get an even bigger crapton of images, and try to do an estimate of the space. Graphs are easy to work with and visualize, so instead of sets (as we used above) let’s now talk about this in a graph framework. I’m going to try the following:
- Start with a big list of (likely) base containers (e.g., Docker library images)
- Derive similarity scores based on the rough approach above. We can determine likely parents / children based on one image containing all the paths of another plus more (a child), or a subset of the paths of the other (a parent). This will give us a bunch of tiny graphs, and pairwise similarity scores for all images.
- Within the tiny graphs, define potential parent nodes (images) as those that have not been found to be children of any other images.
- For all neighbors / children within a tiny graph, do the equivalent comparison, but now on the level of files to get a finer detail score.
- Find a strategy to connect the tiny graphs. The similarity scores can do well to generate a graph of all nodes, but we would want a directional graph with nice detail about software installed, etc.
The last few points are kind of rough, because I’m not ready yet to think about how to fine tune the graph given that I need to build it first. I know a lot of researchers think everything through really carefully before writing any code or trying things, but I don’t have patience for planing and not doing, and like jumping in, starting building, and adjusting as I go. On second thought, I might even want to err away from Singularity to give this a first try. If I use Docker files that have a clear statement about the “parent” image, that means that I have a gold standard, and I can see how well the approach does to find those relationships based on the paths alone.
Classifying a new image into this space
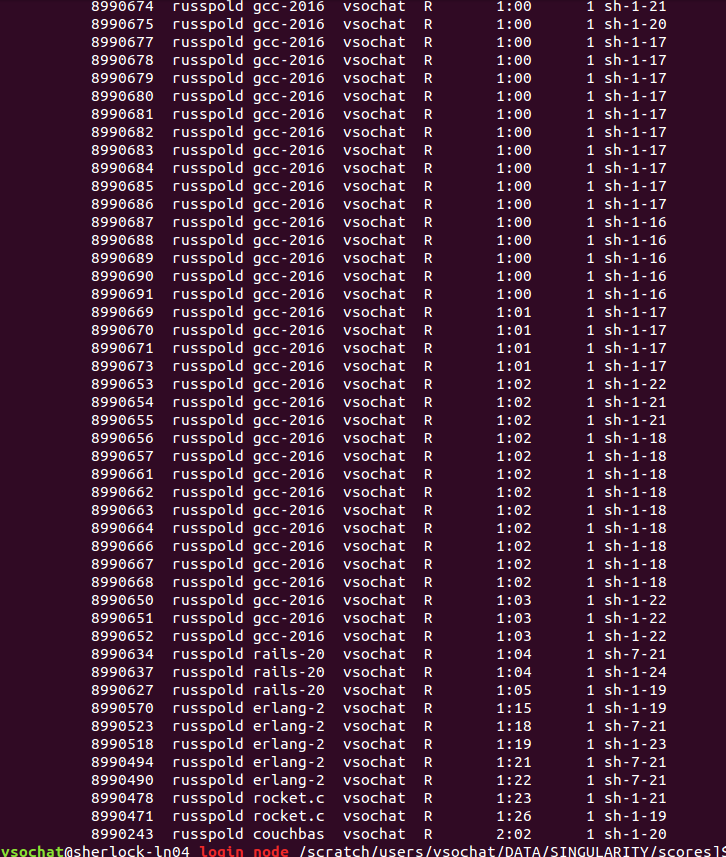
Generating a rough heatmap of image similarity (and you could make a graph from this) isn’t too wild an idea, as we’ve seen above. The more challenging, and the reason that this functionality is useful, is quickly classifying a new image into this space. Why? I’d want to, on the command line, get either a list or open a web interface to immediately see the differences between two images. I’d want to know if the image that I made is similar to something already out there, or if there is a base image that removes some of the redundancy for the image that I made. What I’m leading into is the idea that I want visualizations, and I want tools. Our current understanding of an operating system looks like this:
Yep, that’s my command line. Everything that I do, notably in Linux, I ssh, open a terminal, and I’ll probably type “ls.” If I have two Linuxy things like containers, do we even have developed methods for comparing them? Do they have the same version of Python? Is one created from the other? I want tools and visualization to help me understand these things.
We don’t need pairwise comparisons - we need bases
It would be terrible if, to classify a new image into this space, we had to compare it to every image in our database. We don’t need to, because we can compare it to some set of base images (the highest level of parent nodes that don’t have parents), and then classify it into the graph by walking down the tree, following the most similar path(s). These “base” images we might determine easily based on something like Dockerfiles, but I’d bet we can find them with an algorithm. To be clear, a base image is a kind of special case, for example, those “official” Docker library images like Ubuntu, or Nginx, or postgres that many others are likely to build off of. They are likely to have few to no parent images themselves. It is likely the case that people will add on to base images, and it is less likely they will subtract from them (when is the last time you deleted stuff from your VM when you were extending another image?). Thus, a base image can likely be found by doing the following:
- Parse a crapton of Docker files, and find the images that are most frequently used
- Logically, an image that extends some other image is a child of that image. We can build a graph/tree based on this
- We can cut the tree at some low branch to define a core set of bases.
Questions and work in progress!
I was working on something entirely different when I stumbled on this interesting problem. Specifically, I want a programmatic way to automatically label the software in an image. In order to do this, I need to derive interesting “tags.” An interesting tag is basically some software that is installed on top of the base OS. You see how this developed - I needed to derive a set of base OS, and I needed a way to compare things to them. I’ll get back to that, along with the other fun project that I’ve started to go with this - developing visualizations for comparing operating systems! This is for another day! If you are interested in the original work, I am developing a workflow interface using Singularity containers called Singularity Hub Hubba, hubba!.
Suggested Citation:
Sochat, Vanessa. "How similar are my operating systems?." @vsoch (blog), 17 Jul 2016, https://vsoch.github.io/2016/see-my-os/ (accessed 20 Jun 26).