I’ve been deeply immersed in Kubernetes and performance analysis and workflow software, but found my mind wandering on Friday night with a very specific question:
What portion of research software becomes dormant after it’s published?
I will preface this saying that I have a strong opinion about research software. I believe that it is a living and changing thing. A piece of software that is valuable simply cannot be used once and then not have requests for bug fixes, updates, or otherwise changes. Even if software could hypothetically be perfect (I do not believe that it can), the underlying languages and build or CI systems change over time that would warrant updates to a repository. This means that I can come to the following conclusion:
Research software that is valued will continue to be worked on after any kind of publication date
You might disagree, and that’s OK. I believe that good research software does not just include the code, but the initial developers figuring out how to grow community around it. Yes, this indeed does suggest that establishing a strategy for sustainability is part of being a developer of research software. If you didn’t do that, then your software falls into the bucket of “used once and forgotten.” I will touch more on this in the Discussion at the end of the post.
But why should a general project need to be updated?
The reason is that the changing ecosystem demands it. We can look at the languages plot on the RSEPedia website (updated weekly) to see that most of our projects are R and Python. Here is what it looks like as of today, October 21 2023:
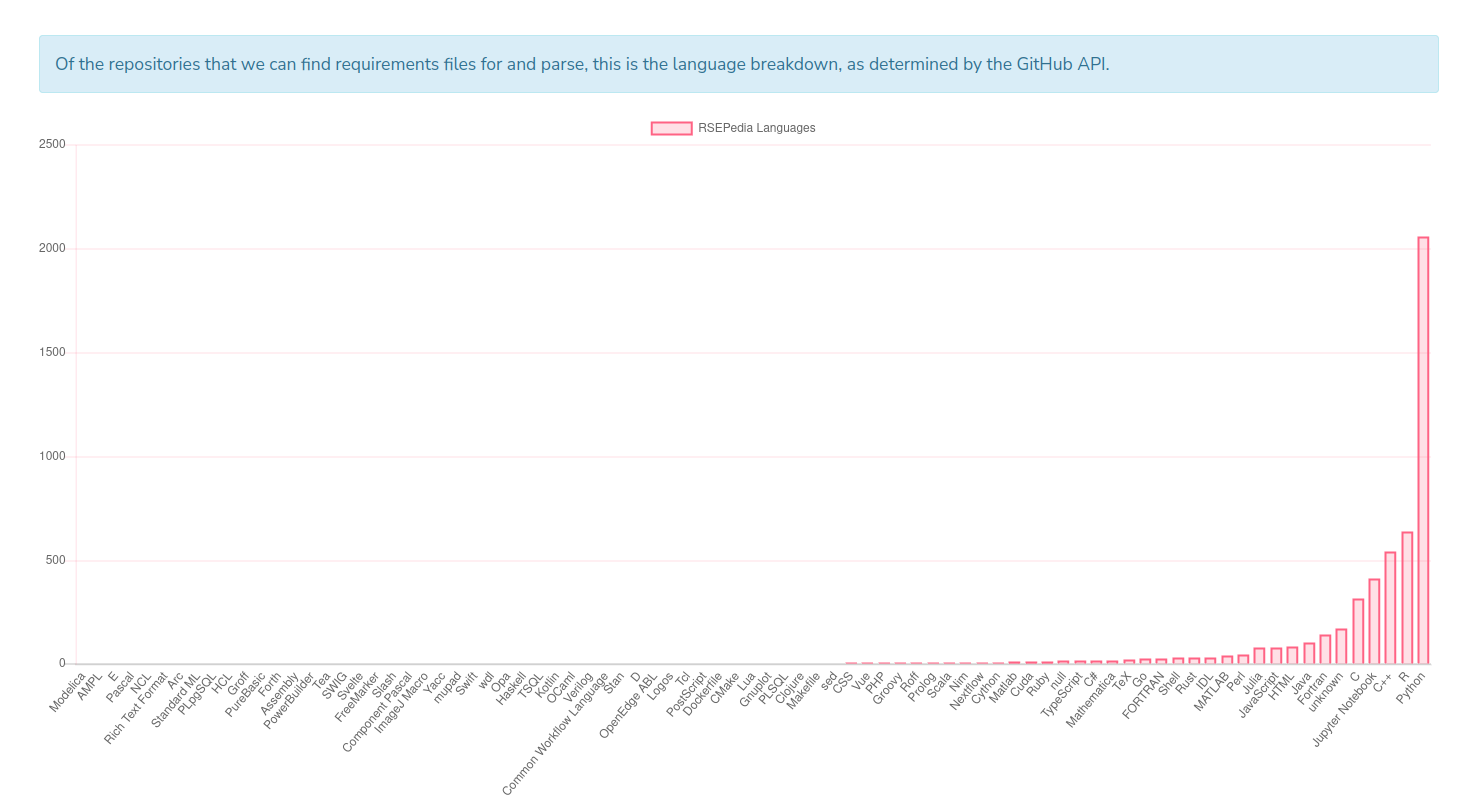
We can see that most projects are Python, R, C++, etc. But it doesn’t need to be stated that these languages change (and get deprecated) over time. Let’s now talk about these questions, and how I used the RSEPedia to start to answer them.
The Research Software Encyclopedia Database
The Research Software Encyclopedia has now existed for several years (obviously it existed before it was published) and from it I’ve also been able to do a weekly analysis based on a tool to establish credit called CiteLang. I must admit I’ve largely abandoned this track of work because I don’t believe it is where I can have most impact, but that is another topic. The reason I bring this up today is because the RSEPedia can offer us a very simple set of metrics that are insightful to the questions above. Let’s talk about those next.
Date added to the software database
Since the RSEPedia runs a set of scrapers for popular software repositories weekly, the date that a project is added to the database can serve as a proxy for when it is either made public, released, or published (in the case of a journal source like the Journal of Research Software). The update happens once a week, so we can round our dates to the nearest week. And actually, for a subset (likely about 1/5 that are published in JoSS) we can do better - parsing the Zenodo record to get the exact publication date. Having reviewed and published there a few times, I can attest that people usually add the records explicitly for the publication. In summary:
The RSEPedia can give us an estimated date for when a piece of software was published.
Date of most recent commit
If value is indicated by activity, I am choosing a commit to the primary branch as an indication that the repository is still active. You can imagine there are other ways to derive activity, such as issues or frequency of commits, but I will start with this simple, single timestamp, and make the declaration that a software project was commit to recently, it is still alive and breathing. If anything, it’s an unfair metric that gives credit to commits that might be something like a spelling mistake getting fixed a few years later. That’s probably OK for now, because we give the project credit for even that.
The most recent commit can be used as a proxy for activity.
With these two values, I could proceed to do a small analysis. Take a look at the scripts there if you are interested, as they show how to use the RSEPedia programmatically (possibly for your own means).
Analysis
I am hypothesizing, based on what I know about publication and incentives that we will see activity decrease after the software is added to some software database, which is a proxy for the publication or being finished date. Yes, there are other reasons that it might stop such as funding running out, or someone claiming it is “finished” but I’m going to again point to my statement above that valuable research software is a living, changing thing that needs to continue changing with the ecosystem, and evidence of this life is indicative of value. Both of these cases suggest not being active (and the reason largely doesn’t matter) and thus not greatly valued.
Most recent commit vs. database addition
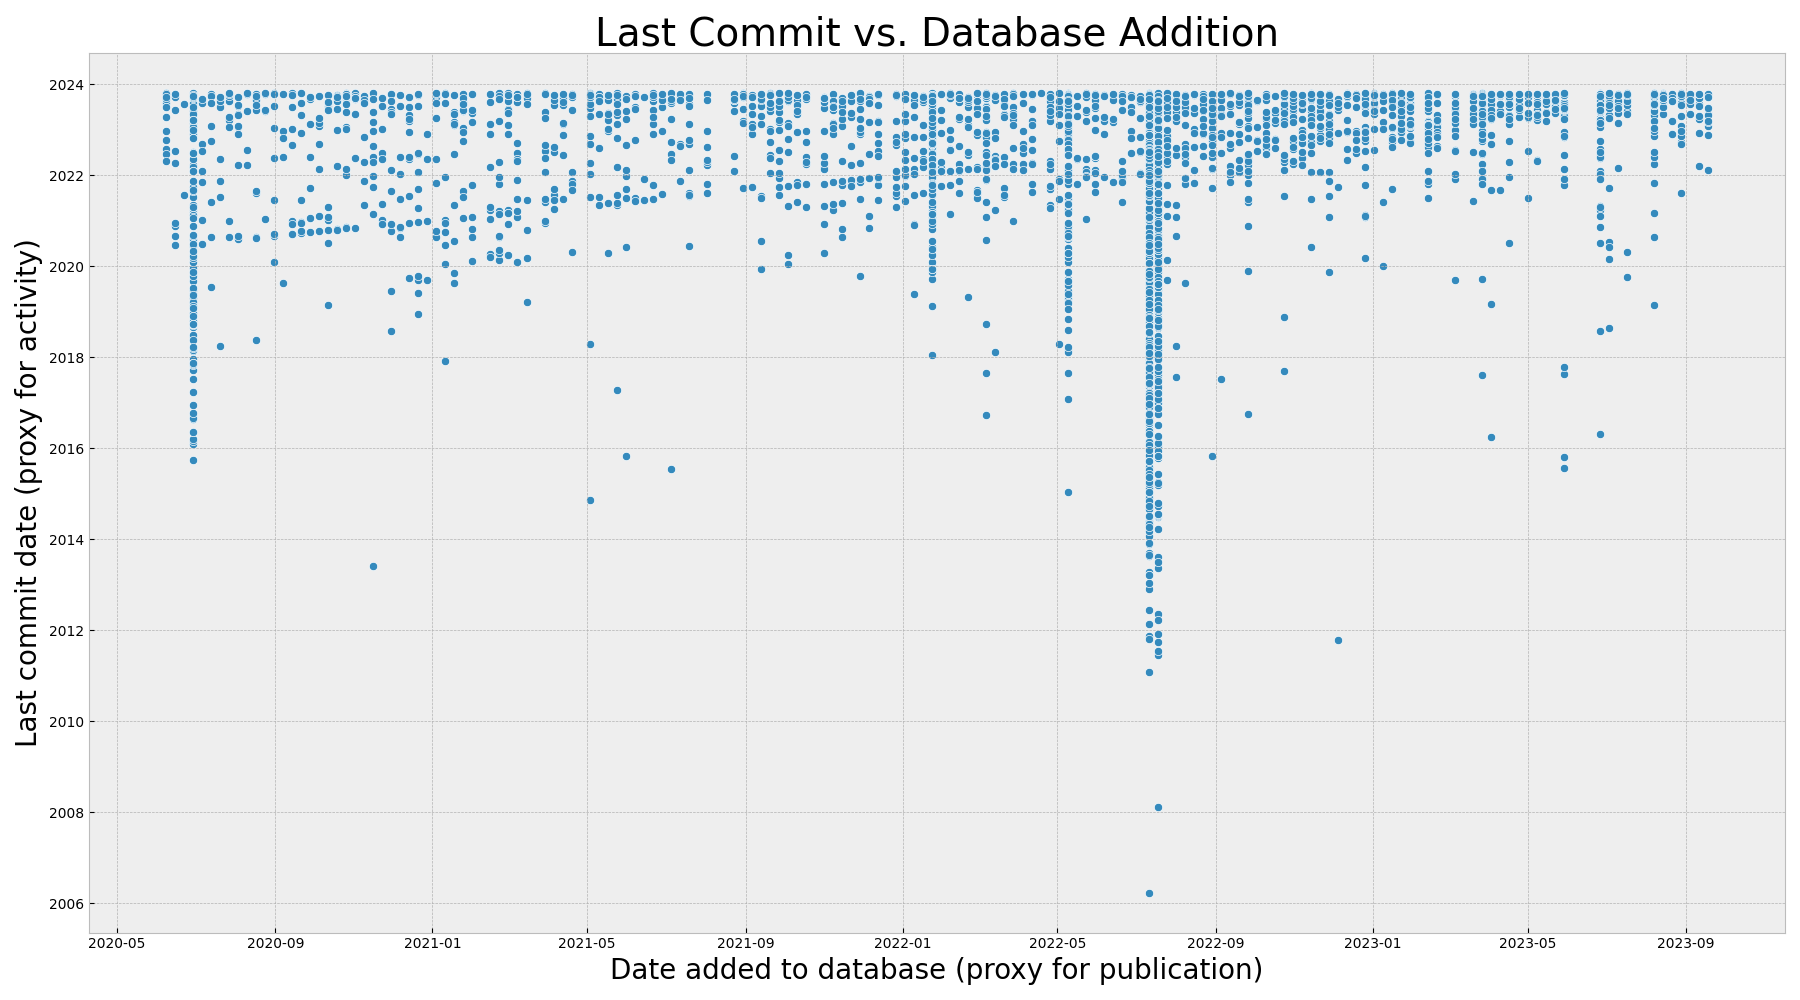
What we are looking at below is the most recent commit (Y) as a function of the date addition to the RSEPedia database (X). While the RSEPedia isn’t a perfect proxy for publication, in that it is updated weekly, it is definitely a proxy.
To summarize the above:
The vertical lines are dates when new scrapers were added to the RSEPedia, and the trending line shows that research software often has a last commit when added to the RSEPedia.
There are more subtle details to the above, and I want to point out some patterns that are interesting or salient. I’ll start with small details about the graph itself. If you are interested in the result, you probably want to jump to vertical lines.
Gaps in Date Added
GitHub actions isn’t perfect, and some weeks the update fails. These are represented as gaps in the graph along the X axis - weeks we don’t have any updates. If I’m not super busy, I can usually run it locally or re-run in the actions interface. But if I’m busy, I won’t make the time. Indeed you can see that I’ve been fairly busy since May this year - with lots of interesting work and talks that doesn’t mean I couldn’t make time, but means that I decide to do other things instead. Yes, a high bus factor there. This also means that some of the points from the following week could have been published the previous week, and we are a week off. It’s not perfect, but data rarely is, and I’m OK with that, because I still think there is signal here.
Recent Dates
On the right side of the plot are recent publications or additions to the RSEPedia, and I think the appearance of density is a recency effect. In simple terms, if a repository was added (published) recently it’s more likely to have been worked on recently too. If we were to hypothetically jump into the future, a bunch of those points would maintain the same publication / added date but not move up into the group of “committed very recently” so the density would decrease. This is just my speculation.
Lower Outliers
Ah, now let’s talk about those points that appear to be hanging low! These are projects that were worked on a long time ago but then added to the database or published much later. Doing a spot check of the data, here is an example repository that hasn’t been updated for 6 years (as of today). This was added via the ascl scraper. This comes down to the type of research software database that the software is from. Some are more archival than anything else.
Vertical Lines
The RSEPedia is powered by scrapers. A scraper is another database that I can retrieve software (and associated repositories on GitHub or GitLab) for. As time has passed, I’ve added new scrapers. The vertical lines represent dates that I’ve added a whole bunch of new projects from a new scraped resource. For example, you can see that I added a few scrapers in the middle of 2022. This is important to note because when a new scraper is added, we can’t say with any confidence that those dates reflect when the represented software was published or finalized. More likely these points should be added much earlier. For this reason, we see a vertical line created by a group of added dates (X) that are one point in time across many times in the past (Y).
What does this mean? It means that since we don’t have a timepoint between when the software was definitely not in the associated database and when it was (the previous date is unknown, at least in this dataset) we can at most say that the project minimally existed and was published as late as that date, and moving forward from that date, activity still is a positive indicator of being valued. You can see the few times that I added a bunch of new scrapers - notably in early 2022 with the first set, and then a bunch at different times in 2022.
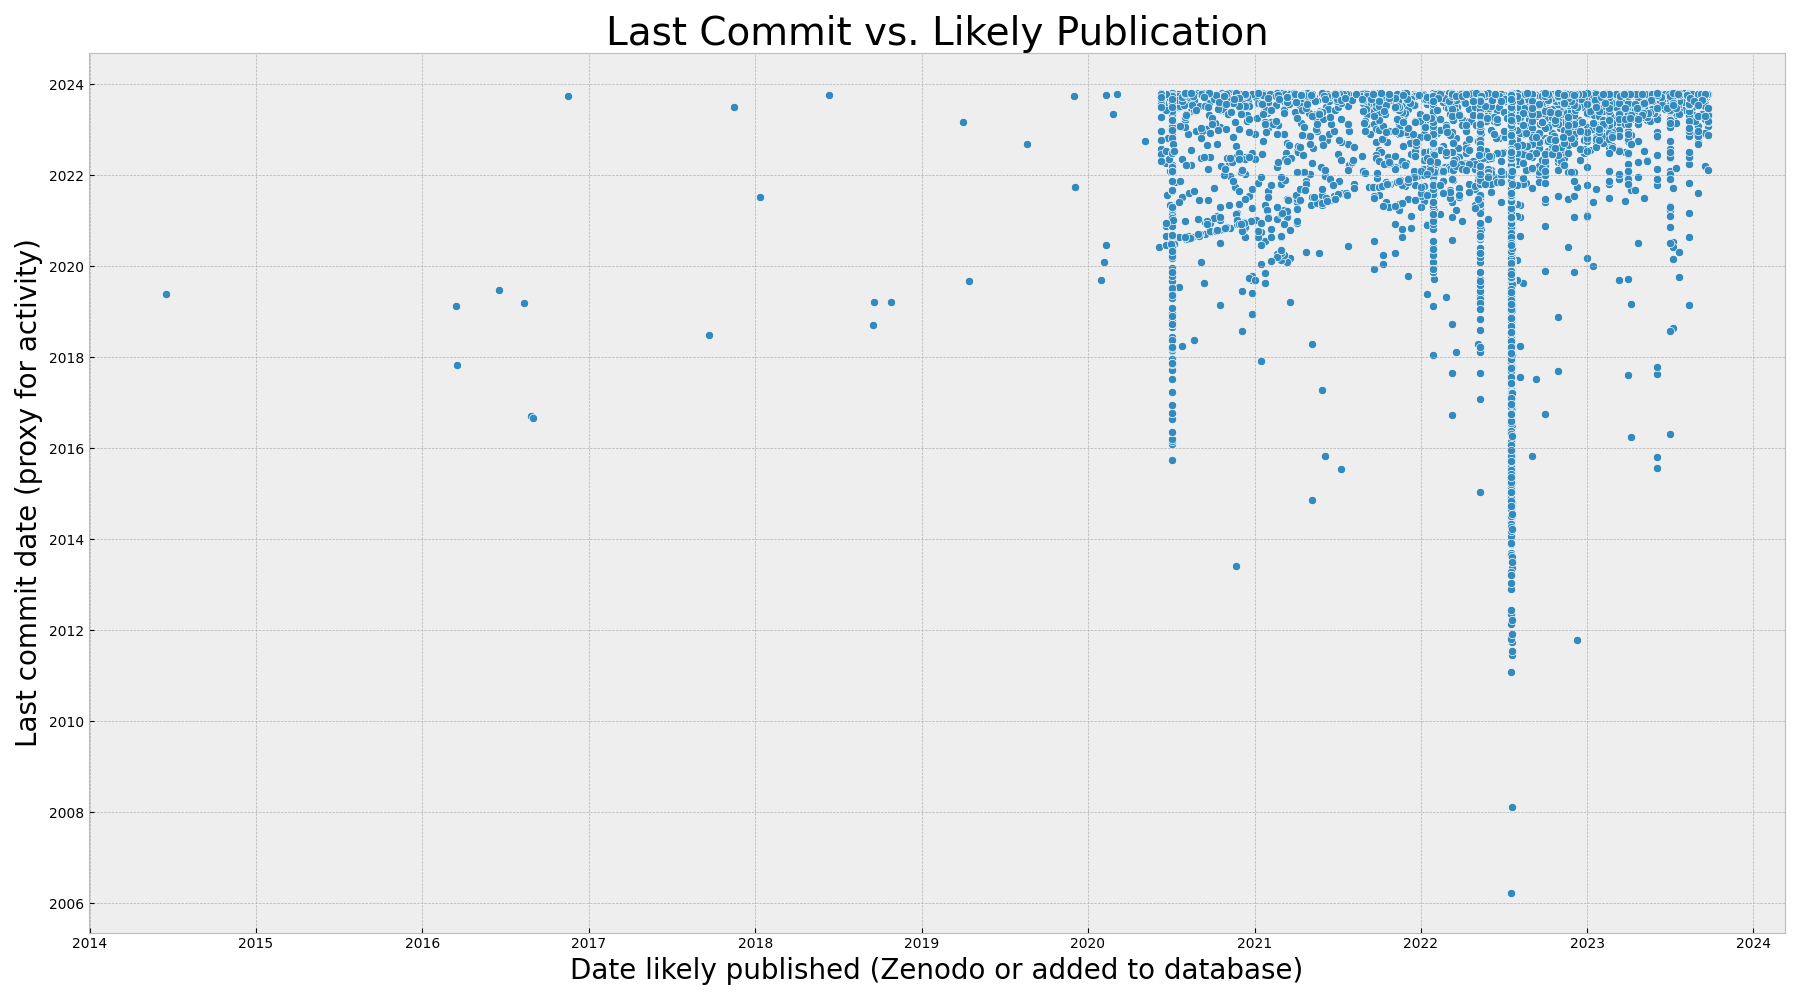
But I thought I could do a little bit better by using the Zenodo records associated with a subset of these RSEPedia entries, and replacing a subset of the database added dates (N=864) with those from Zenodo instead:
To summarize the above, we see exactly that:
The Zenodo publication date is a more accurate publication date, and when we replace RSEPedia addition dates with Zenodo published dates we see a similar pattern. The graph is simply extended on the X axis to before 2020 (before the RSEPedia existed)!
It really looks to be mostly the same plot except the scale on the X axis is stretched to 2014 because a very small number of points have shifted to the left to indicate the date they were published on Zenodo. We still see the pattern of vertical lines. What if we removed everything except for Zenodo, which you can think of as our “high confidence” dates?
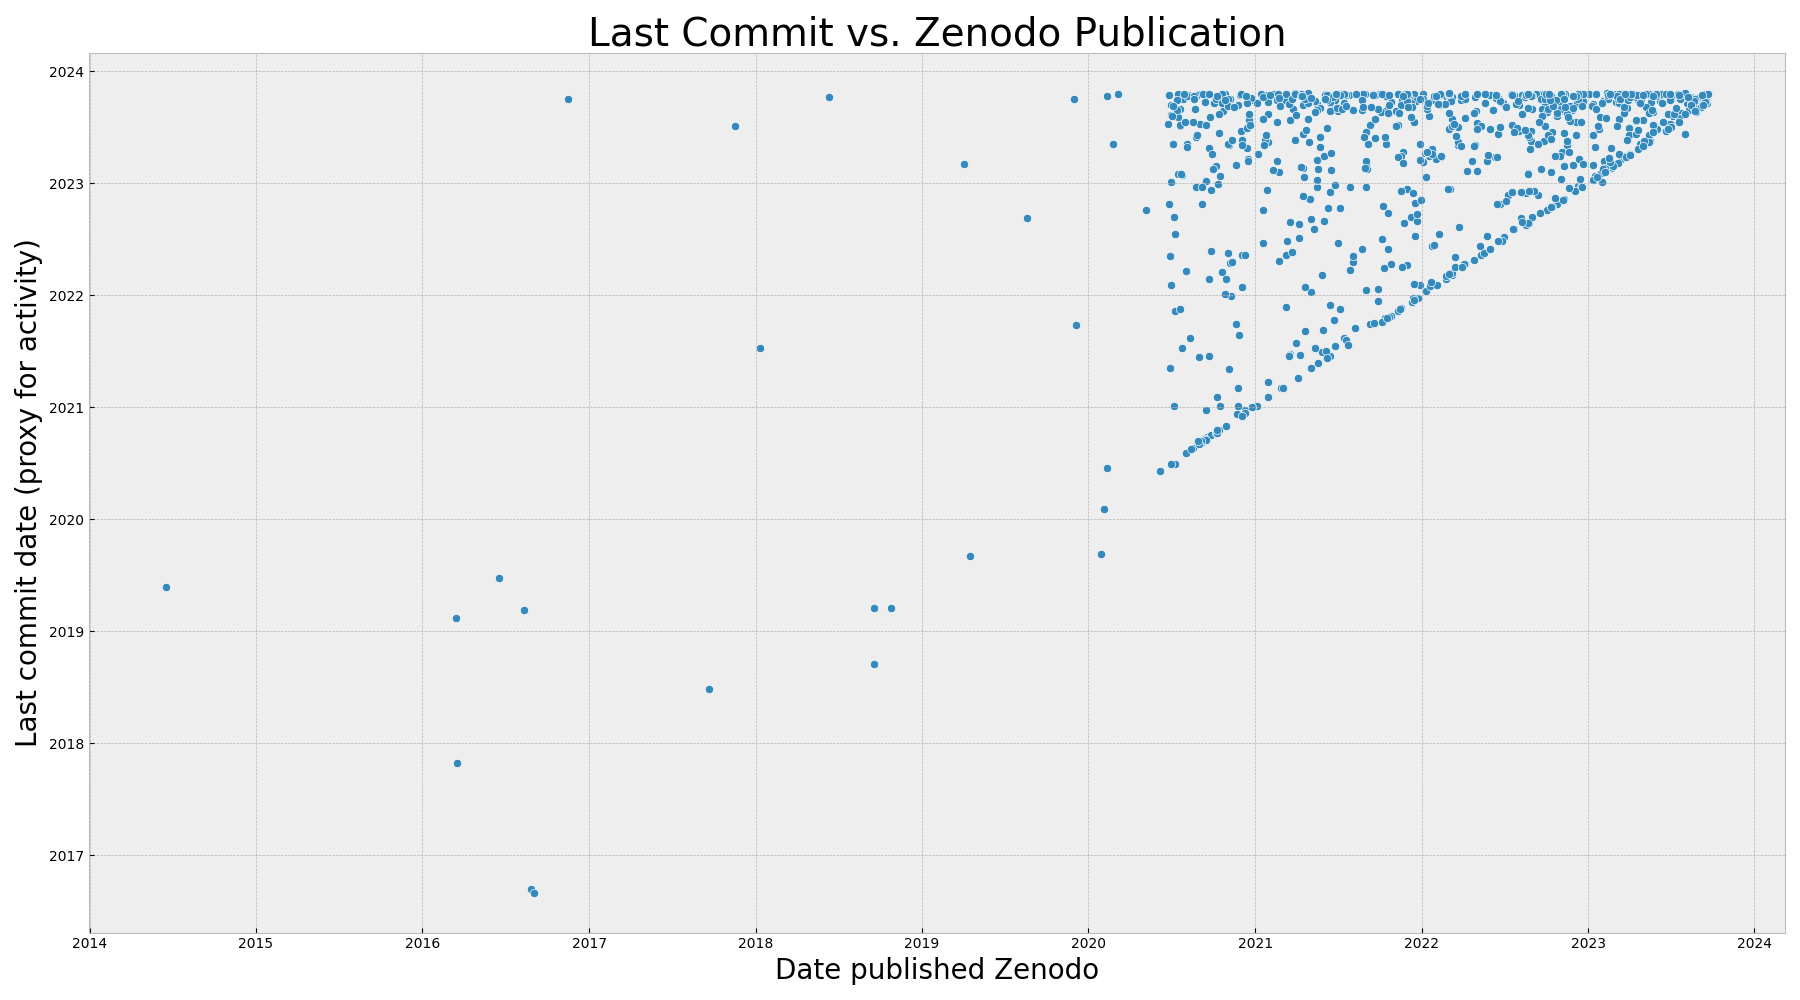
When we filter down to those with a Zenodo publication date (above), we see a stronger trend line of dates published matching last commit date (the line where X==Y). We also see a strong signal of projects published in the last 2 years that are still worked on (the higher density at the top) and projects in between that were edited since they were published, but maybe less than a year after. The reason this subset is limited is because the majority of these Zenodo DOIs were only added with publications in the last few years. We need a few more years of data (and to track these repos) to truly understand how the pattern will continue. Based on the larger dataset, very likely many of the projects published in the last year or two will become more dormant, but that is my speculation.
Does this plot represent a reliable or consistent pattern over time?
I think not, or at least we cannot say because it’s not enough data. Since the Zenodo results are only a very small subset of the data (about 16%) and they essentially filter out a huge subset of software projects that simply were published in another database, I think it represents a sample but possibly not some kind of truth.
Trending lines
Do you see them? You probably do (and we’ve talked about them) but I want to call them out explicitly I am too impatient with plotting libraries to figure out how to draw a trend line between equivalent dates on the axis, but interestingly enough this came out with the data! And these lines are what I find to be most interesting in this view of the data. There are three patterns that I see:
- Vertical lines don't have meaning aside from groups of software being added
- The line on the bottom (where last commit == publication) represents software that is published and forgotten.
- The line at the top is high valued software that (regardless of publication) continues to be worked on.
The second line represents a strong signal of repositories that had their last commit at (or close to) the date when they were added to the RSEPedia or published on Zenodo. Everything above the line had a last commit that was after the addition to the RSEPedia (logical since there is a week delay) and every point under that line had a commit that was added before it was added to the RSEPedia. This can also make sense for the database, because some of the databases are more archives than anything else. If the addition to the RSEPedia (sans the vertical lines) is an indication of some kind of final release of publication then this is a powerful message:
Of the sample that we have, a non-zero number of projects’ activity dies out at the point of publication.
But it’s not such a terrible story, because the points above the line were continued to be worked on after publication. However, keep in mind how squished the Y axis is - an entire year is in half an inch, so we might see a different story if we look at the number of projects that have been worked on in the last N months. Hey, let’s do that next!
Updated Repositories Over Time
The plots above give us a gist of (an estimated) publication date vs the last commit, but they don’t tell us easily or directly of the entire set, how many have been worked on in the last N months. For example, a project with a last commit in the last month is likely more active than one that had a last commit 6 months ago, but on our scatterplot those points would be fairly close together. The plots above also don’t easily show us temporal value. A project that was created 10 years ago that still has active commits in the last month is likely very highly valued. Let’s look at this trend over time, starting with time 0 (the creation of the RSEPedia in early 2020) until this month (41 months later):
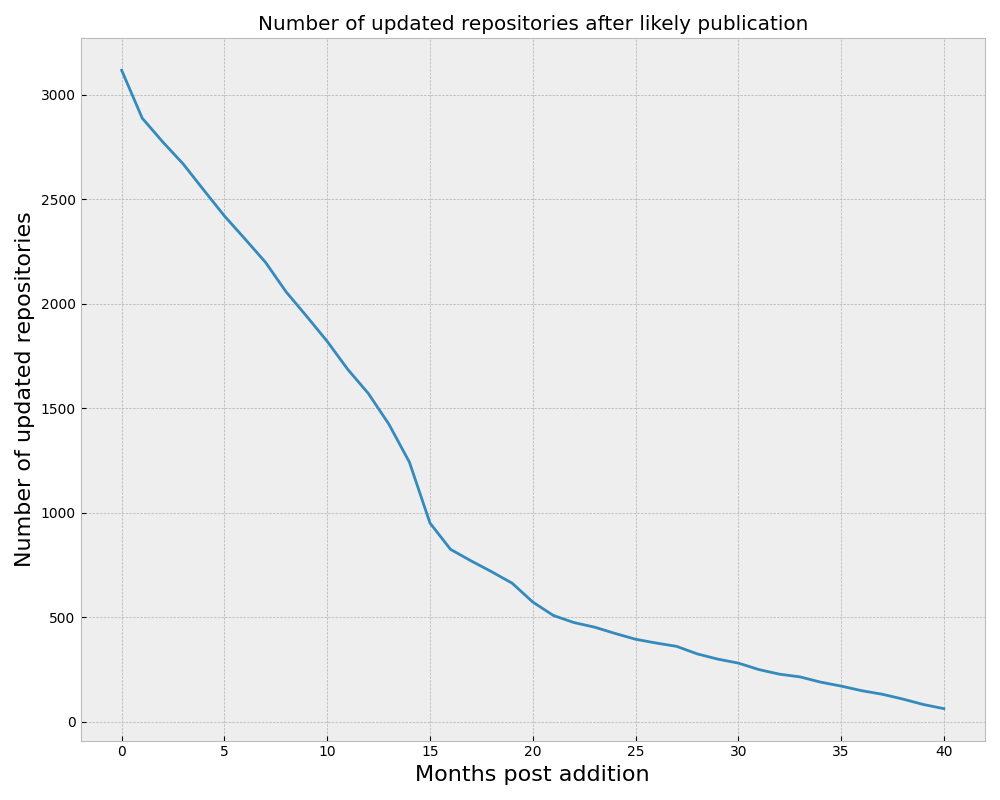
In the above, we are looking at the total count of projects that are still being updated at different frequencies (months) after their initial publication. Note that the age of the project is taken into account here, meaning that the smallest value on the right also reflects that fewer projects have been around that long. I think this is really (and to see the change in slope) because because it creates a new hypothesis:
If a project survives a certain amount of time and is still active, it is more likely to be valued.
In other words, those that survive the first few years of being published and existing, and then that are still worked on, are more robust. There are fewer of them as time passes, but the fewer are more likely to survive. This says something, and it will take more work to further tell this story (if anyone is interested! This is a fun Saturday project for me).
High Value Projects
To go back to what I declared at the start of this post, I think that high value projects are those that have stood the test of time and are still alive and kicking. This means that for a large set of our software we cannot say a lot, because a few years isn’t a very long time to be around. But here are the projects that, according to this small analysis, are still alive and kicking 40 months after their initial publication (or addition to the RSEPedia).
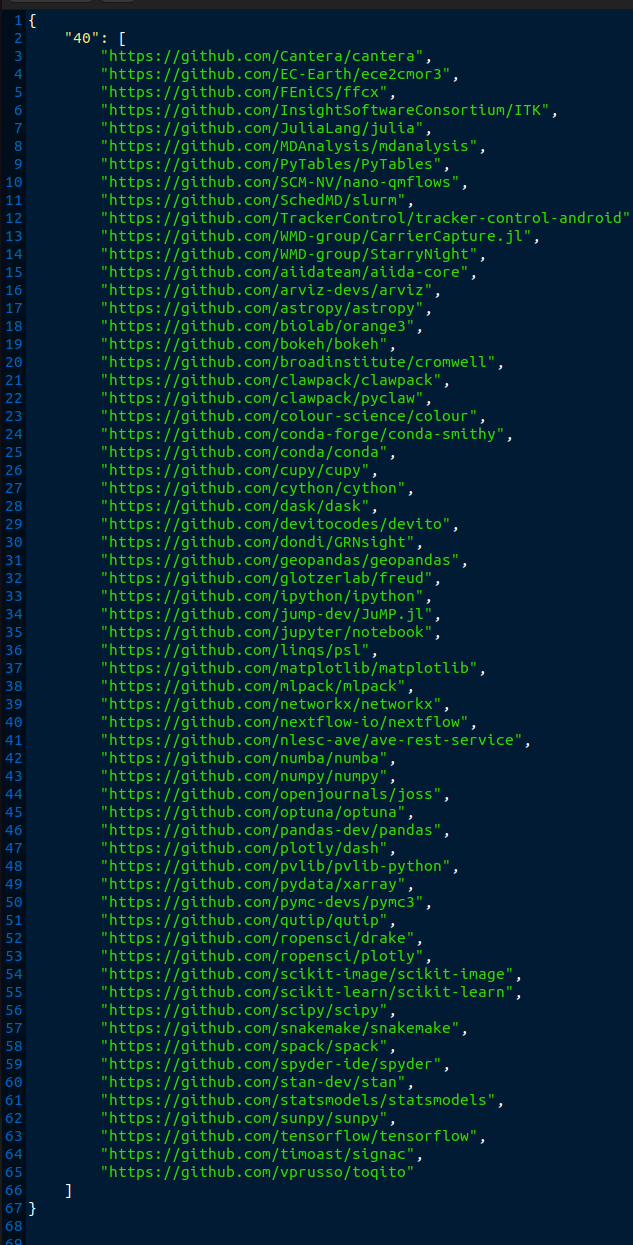
Do you see what I see? This is only a biased sampling of the real space because, for example, a data formatting or parsing library would never be added to a research software database, but I see:
- Package managers
- Workflow tools
- Languages
- Plotting libraries
- Machine learning and stats
- Core numerical libraries
- Projects with sustainable funding.
And these are only the projects that someone went out of their way to say “Hey we should add this to insert research software database. And just to be transparent,
Discussion
Long and Forgotten?
I opened the post making a strong claim about the value of research software, and that it only serves a purpose in as long as it persists. I want to now say this isn’t entirely true. If I look on the work that I (or colleagues that I know well have done) it’s often the case that the large majority of our work is not successful under these criteria. “Then what’s the point?” we might ask. The point is that there is learning in the process. A failed project is not failed if you (or others) took away lessons from it. A project is not failed if it inspired something next, or if you just enjoyed creating it. It’s the same as a piece of research, in a way, because each incremental development offers some marginal benefit by way of learning or growth. However, to be valued in the sense of contributing strongly to the research landscape, a project probably does need to be valued by others, and persist the test of time.
My Own Software
Much of the software that I write is for my own learning and fun, but I was tickled to see that a few of my container-related projects popped up in the high value list for the frame of 24 months. I will attest that I don’t think sregistry should be there because it’s a much better idea to push your Singularity containers to an ORAS registry, but it does seem that folks still seem to come and want to use it. The project I’m most proud of in that list is probably singularity-hpc because it does feel like it is having impact at actual HPC centers and inspiring people. Do I think any of my software will have value in 10, 20, 100 years? Probably not. And this is why I try to maximally have fun and enjoy the work. One could say similar things about life, but that is probably a bit too much for this post.
More Limitations
It’s funny, but I often write a longer “Limitations” section for my papers than the “I want to convince you this is great!” section. The reason is because most things aren’t great, they are (at best) glimpses into signals. So without further delay, I want to list more limitations to this (one day Saturday!) study. First, we can’t say anything about the newest added software. It could never be updated again, or it could be the most successful and active software ever. Only time will tell. It’s also the case that a single commit may not be the best indicator of activity. However, it does reflect the heartbeat of a repository in a sense. Dormant repositories tend to not have a last commit for years. There could be another kind of signal of value through opening issues that isn’t addressed via commits (meaning the project is valued but the developers/researchers don’t have bandwidth to help). For these projects, we might seek out to find them (and find a way to pass on maintainer responsibilities to someones that have the time). And finally, as stated before, the RSEPedia is just a rough estimate. Aside from it being updated just once a week, it doesn’t capture the perfect date of publication. Someone would need to do a lot of manual work to do that, and I’m not willing or wanting to.
Publication of Software
For me, there is a huge amount of missing signal here. This is only projects that are “academically published” and it leaves out so many that (according to the RSEPedia analysis) are hugely valued. This is where I think the push to publish software by way of traditional means is somewhat misguided. If a huge amount of energy is spent on getting a publication and citation, it often feels like it is time and energy that might better be spent on community growth, collaboration, or just development. This is my own platform to speak, so I can say that openly. In a previous life when I identified more strongly with this community I made efforts to inspire others to think outside of this box, and well, people were threatened by that. I still will assert this today that I hope those that work on research software can find other ways to derive value for it. With this simple analysis I’ve now done this several times.
But isn’t it interesting how small of active projects we get from a database of over 5000? This means that (largely speaking) if you stumble on a repository that claims to be research software, it most likely has not had activity in a while. It maybe had work stop around when it was published. This means it was published for a specific purpose, and maybe that’s OK, but (as a developer that likes thinking about how things generalize and can have larger impact) it’s not good enough for me. Maybe that is why I’ve migrated away from research software engineer to something else. Making one-off projects for a specific publication or pipeline was not enough.
I also need to address the elephant in the room, that there are larger reasons behind this pattern (e.g., problems with the funding and incentive model). For now the basis of my thinking is assuming that software development operates on this imperfect system, and there are projects out there that have found a way to persist and be valued. Living and valued software survives, regardless. The user base demands it. When a maintainer cannot do it, someone steps up. It finds a way.
Summary
We’ve identified interesting patterns in the above. My hat goes off to the projects that have been around a long time and are still being worked on. Perhaps there are lessons to be learned there. And I hope that others (that care about this ecosystem) take note and try out new ways to develop high quality, enduring software. I am more likely (at least for the time being) to be working on Kubernetes and Go projects and schedulers, because that’s where my heart is at the moment. And if I’ve learned anything, good software comes from there. <3
- This post is referenced in the Research Computing Teams Newsletter
Suggested Citation:
Sochat, Vanessa. "Updated Software is Valued Software." @vsoch (blog), 21 Oct 2023, https://vsoch.github.io/2023/valued-software/ (accessed 20 Jun 26).